Zimbabwean vs Immigrants from Norway Child Poverty Under the Age of 5
COMPARE
Zimbabwean
Immigrants from Norway
Child Poverty Under the Age of 5
Child Poverty Under the Age of 5 Comparison
Zimbabweans
Immigrants from Norway
15.2%
CHILD POVERTY UNDER THE AGE OF 5
99.0/ 100
METRIC RATING
68th/ 347
METRIC RANK
16.3%
CHILD POVERTY UNDER THE AGE OF 5
89.3/ 100
METRIC RATING
130th/ 347
METRIC RANK
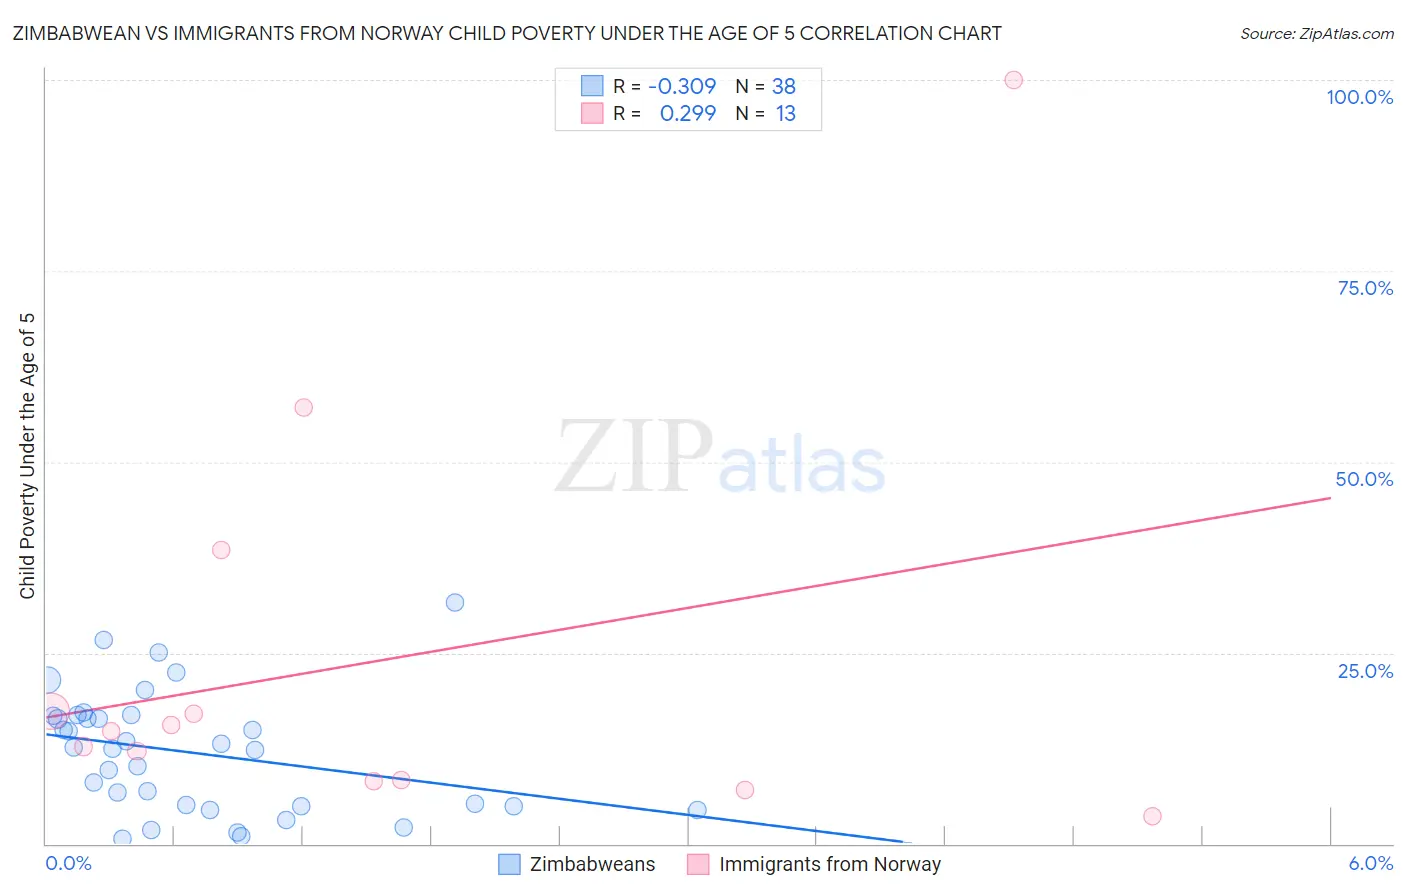
Zimbabwean vs Immigrants from Norway Child Poverty Under the Age of 5 Correlation Chart
The statistical analysis conducted on geographies consisting of 68,606,248 people shows a mild negative correlation between the proportion of Zimbabweans and poverty level among children under the age of 5 in the United States with a correlation coefficient (R) of -0.309 and weighted average of 15.2%. Similarly, the statistical analysis conducted on geographies consisting of 114,119,932 people shows a weak positive correlation between the proportion of Immigrants from Norway and poverty level among children under the age of 5 in the United States with a correlation coefficient (R) of 0.299 and weighted average of 16.3%, a difference of 7.2%.
Child Poverty Under the Age of 5 Correlation Summary
| Measurement | Zimbabwean | Immigrants from Norway |
| Minimum | 0.66% | 3.6% |
| Maximum | 31.6% | 100.0% |
| Range | 31.0% | 96.4% |
| Mean | 11.9% | 24.0% |
| Median | 12.5% | 14.7% |
| Interquartile 25% (IQ1) | 4.9% | 8.3% |
| Interquartile 75% (IQ3) | 16.8% | 27.9% |
| Interquartile Range (IQR) | 11.9% | 19.6% |
| Standard Deviation (Sample) | 7.8% | 27.1% |
| Standard Deviation (Population) | 7.7% | 26.0% |
Similar Demographics by Child Poverty Under the Age of 5
Demographics Similar to Zimbabweans by Child Poverty Under the Age of 5
In terms of child poverty under the age of 5, the demographic groups most similar to Zimbabweans are Greek (15.2%, a difference of 0.0%), Lithuanian (15.2%, a difference of 0.010%), Immigrants from Scotland (15.2%, a difference of 0.070%), Immigrants from Fiji (15.2%, a difference of 0.18%), and Immigrants from Romania (15.2%, a difference of 0.21%).
| Demographics | Rating | Rank | Child Poverty Under the Age of 5 |
| Immigrants | Poland | 99.1 /100 | #61 | Exceptional 15.1% |
| Immigrants | Eastern Europe | 99.1 /100 | #62 | Exceptional 15.1% |
| Immigrants | Europe | 99.1 /100 | #63 | Exceptional 15.1% |
| Immigrants | Romania | 99.1 /100 | #64 | Exceptional 15.2% |
| Immigrants | Fiji | 99.0 /100 | #65 | Exceptional 15.2% |
| Immigrants | Scotland | 99.0 /100 | #66 | Exceptional 15.2% |
| Greeks | 99.0 /100 | #67 | Exceptional 15.2% |
| Zimbabweans | 99.0 /100 | #68 | Exceptional 15.2% |
| Lithuanians | 99.0 /100 | #69 | Exceptional 15.2% |
| Immigrants | Belgium | 98.8 /100 | #70 | Exceptional 15.3% |
| Immigrants | Egypt | 98.8 /100 | #71 | Exceptional 15.3% |
| Immigrants | Sweden | 98.8 /100 | #72 | Exceptional 15.3% |
| Immigrants | Ukraine | 98.7 /100 | #73 | Exceptional 15.3% |
| Argentineans | 98.5 /100 | #74 | Exceptional 15.4% |
| Immigrants | Argentina | 98.5 /100 | #75 | Exceptional 15.4% |
Demographics Similar to Immigrants from Norway by Child Poverty Under the Age of 5
In terms of child poverty under the age of 5, the demographic groups most similar to Immigrants from Norway are British (16.3%, a difference of 0.030%), South African (16.2%, a difference of 0.21%), Finnish (16.3%, a difference of 0.29%), Serbian (16.3%, a difference of 0.32%), and Icelander (16.3%, a difference of 0.39%).
| Demographics | Rating | Rank | Child Poverty Under the Age of 5 |
| Austrians | 92.0 /100 | #123 | Exceptional 16.1% |
| Swiss | 92.0 /100 | #124 | Exceptional 16.1% |
| Native Hawaiians | 91.8 /100 | #125 | Exceptional 16.2% |
| Immigrants | Albania | 91.8 /100 | #126 | Exceptional 16.2% |
| Immigrants | England | 91.5 /100 | #127 | Exceptional 16.2% |
| South Africans | 90.1 /100 | #128 | Exceptional 16.2% |
| British | 89.4 /100 | #129 | Excellent 16.3% |
| Immigrants | Norway | 89.3 /100 | #130 | Excellent 16.3% |
| Finns | 88.3 /100 | #131 | Excellent 16.3% |
| Serbians | 88.2 /100 | #132 | Excellent 16.3% |
| Icelanders | 87.9 /100 | #133 | Excellent 16.3% |
| Immigrants | North Macedonia | 87.8 /100 | #134 | Excellent 16.4% |
| Brazilians | 87.8 /100 | #135 | Excellent 16.4% |
| Immigrants | Northern Africa | 87.5 /100 | #136 | Excellent 16.4% |
| Immigrants | Chile | 85.3 /100 | #137 | Excellent 16.4% |