Argentinean vs Immigrants from Norway Single Father Poverty
COMPARE
Argentinean
Immigrants from Norway
Single Father Poverty
Single Father Poverty Comparison
Argentineans
Immigrants from Norway
15.8%
SINGLE FATHER POVERTY
94.4/ 100
METRIC RATING
114th/ 347
METRIC RANK
16.8%
SINGLE FATHER POVERTY
6.5/ 100
METRIC RATING
224th/ 347
METRIC RANK
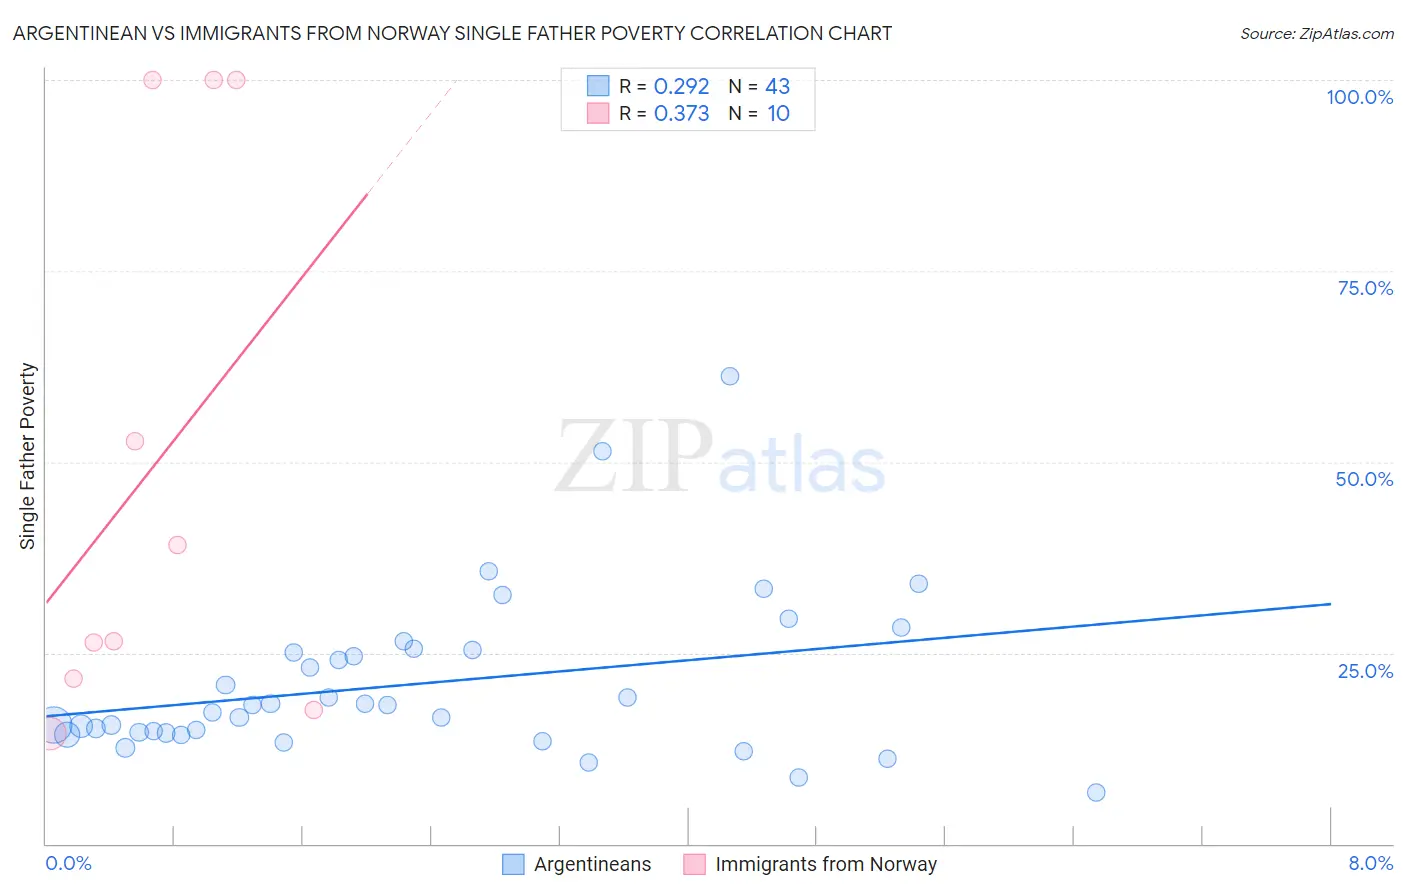
Argentinean vs Immigrants from Norway Single Father Poverty Correlation Chart
The statistical analysis conducted on geographies consisting of 241,909,455 people shows a weak positive correlation between the proportion of Argentineans and poverty level among single fathers in the United States with a correlation coefficient (R) of 0.292 and weighted average of 15.8%. Similarly, the statistical analysis conducted on geographies consisting of 101,345,089 people shows a mild positive correlation between the proportion of Immigrants from Norway and poverty level among single fathers in the United States with a correlation coefficient (R) of 0.373 and weighted average of 16.8%, a difference of 6.3%.
Single Father Poverty Correlation Summary
| Measurement | Argentinean | Immigrants from Norway |
| Minimum | 6.7% | 14.5% |
| Maximum | 61.3% | 100.0% |
| Range | 54.6% | 85.5% |
| Mean | 20.9% | 49.8% |
| Median | 18.2% | 32.8% |
| Interquartile 25% (IQ1) | 14.5% | 21.6% |
| Interquartile 75% (IQ3) | 25.3% | 100.0% |
| Interquartile Range (IQR) | 10.8% | 78.4% |
| Standard Deviation (Sample) | 10.6% | 36.3% |
| Standard Deviation (Population) | 10.5% | 34.4% |
Similar Demographics by Single Father Poverty
Demographics Similar to Argentineans by Single Father Poverty
In terms of single father poverty, the demographic groups most similar to Argentineans are Danish (15.8%, a difference of 0.020%), Immigrants from Latvia (15.8%, a difference of 0.060%), Bulgarian (15.8%, a difference of 0.090%), Immigrants from Africa (15.8%, a difference of 0.14%), and Turkish (15.8%, a difference of 0.15%).
| Demographics | Rating | Rank | Single Father Poverty |
| Native Hawaiians | 95.8 /100 | #107 | Exceptional 15.7% |
| Pakistanis | 95.7 /100 | #108 | Exceptional 15.7% |
| Turks | 95.1 /100 | #109 | Exceptional 15.8% |
| Immigrants | Africa | 95.1 /100 | #110 | Exceptional 15.8% |
| Bulgarians | 94.8 /100 | #111 | Exceptional 15.8% |
| Immigrants | Latvia | 94.7 /100 | #112 | Exceptional 15.8% |
| Danes | 94.5 /100 | #113 | Exceptional 15.8% |
| Argentineans | 94.4 /100 | #114 | Exceptional 15.8% |
| Immigrants | Thailand | 93.6 /100 | #115 | Exceptional 15.8% |
| Immigrants | Argentina | 92.8 /100 | #116 | Exceptional 15.8% |
| Immigrants | Colombia | 92.6 /100 | #117 | Exceptional 15.8% |
| Immigrants | Eastern Europe | 92.5 /100 | #118 | Exceptional 15.8% |
| Immigrants | Belarus | 92.4 /100 | #119 | Exceptional 15.8% |
| Uruguayans | 92.1 /100 | #120 | Exceptional 15.9% |
| Immigrants | Immigrants | 91.9 /100 | #121 | Exceptional 15.9% |
Demographics Similar to Immigrants from Norway by Single Father Poverty
In terms of single father poverty, the demographic groups most similar to Immigrants from Norway are Menominee (16.8%, a difference of 0.020%), Hispanic or Latino (16.8%, a difference of 0.070%), Immigrants from Austria (16.8%, a difference of 0.080%), British (16.8%, a difference of 0.16%), and Belgian (16.8%, a difference of 0.23%).
| Demographics | Rating | Rank | Single Father Poverty |
| Cheyenne | 9.3 /100 | #217 | Tragic 16.7% |
| Immigrants | Uganda | 8.6 /100 | #218 | Tragic 16.7% |
| Immigrants | Ghana | 8.1 /100 | #219 | Tragic 16.7% |
| Immigrants | Denmark | 8.1 /100 | #220 | Tragic 16.7% |
| Immigrants | Greece | 8.1 /100 | #221 | Tragic 16.7% |
| Immigrants | Spain | 8.0 /100 | #222 | Tragic 16.7% |
| Immigrants | Austria | 7.0 /100 | #223 | Tragic 16.8% |
| Immigrants | Norway | 6.5 /100 | #224 | Tragic 16.8% |
| Menominee | 6.4 /100 | #225 | Tragic 16.8% |
| Hispanics or Latinos | 6.1 /100 | #226 | Tragic 16.8% |
| British | 5.6 /100 | #227 | Tragic 16.8% |
| Belgians | 5.3 /100 | #228 | Tragic 16.8% |
| Israelis | 4.6 /100 | #229 | Tragic 16.8% |
| Immigrants | Trinidad and Tobago | 4.5 /100 | #230 | Tragic 16.8% |
| Spanish Americans | 3.7 /100 | #231 | Tragic 16.9% |