Austrian vs Immigrants from Norway Single Father Poverty
COMPARE
Austrian
Immigrants from Norway
Single Father Poverty
Single Father Poverty Comparison
Austrians
Immigrants from Norway
17.1%
SINGLE FATHER POVERTY
1.1/ 100
METRIC RATING
250th/ 347
METRIC RANK
16.8%
SINGLE FATHER POVERTY
6.5/ 100
METRIC RATING
224th/ 347
METRIC RANK
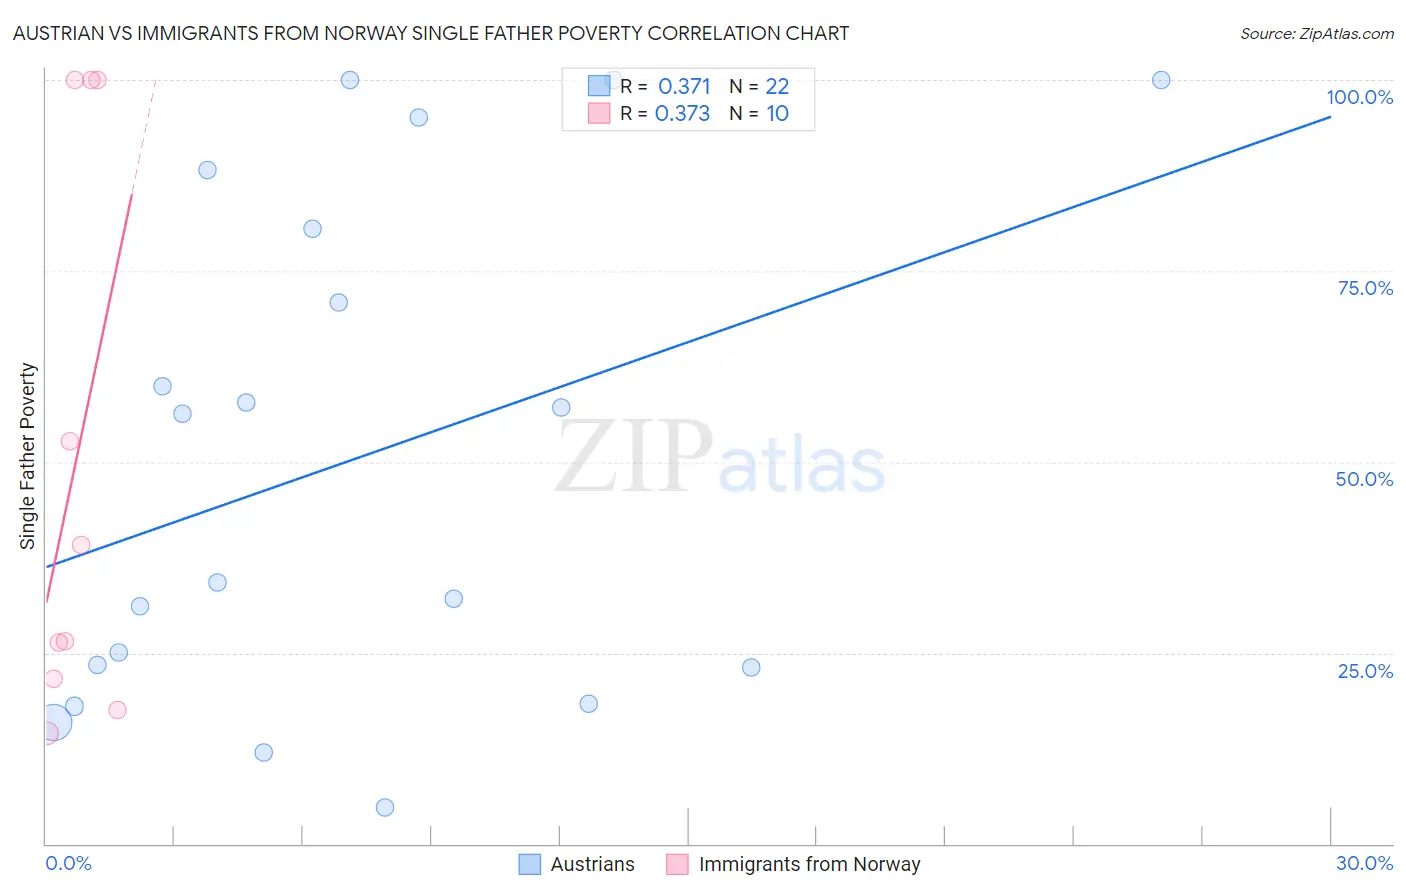
Austrian vs Immigrants from Norway Single Father Poverty Correlation Chart
The statistical analysis conducted on geographies consisting of 340,326,838 people shows a mild positive correlation between the proportion of Austrians and poverty level among single fathers in the United States with a correlation coefficient (R) of 0.371 and weighted average of 17.1%. Similarly, the statistical analysis conducted on geographies consisting of 101,345,089 people shows a mild positive correlation between the proportion of Immigrants from Norway and poverty level among single fathers in the United States with a correlation coefficient (R) of 0.373 and weighted average of 16.8%, a difference of 1.9%.
Single Father Poverty Correlation Summary
| Measurement | Austrian | Immigrants from Norway |
| Minimum | 4.8% | 14.5% |
| Maximum | 100.0% | 100.0% |
| Range | 95.2% | 85.5% |
| Mean | 50.2% | 49.8% |
| Median | 45.2% | 32.8% |
| Interquartile 25% (IQ1) | 23.1% | 21.6% |
| Interquartile 75% (IQ3) | 80.6% | 100.0% |
| Interquartile Range (IQR) | 57.5% | 78.4% |
| Standard Deviation (Sample) | 32.6% | 36.3% |
| Standard Deviation (Population) | 31.8% | 34.4% |
Similar Demographics by Single Father Poverty
Demographics Similar to Austrians by Single Father Poverty
In terms of single father poverty, the demographic groups most similar to Austrians are Luxembourger (17.1%, a difference of 0.010%), Croatian (17.1%, a difference of 0.11%), Cree (17.1%, a difference of 0.11%), Canadian (17.1%, a difference of 0.13%), and Czechoslovakian (17.1%, a difference of 0.17%).
| Demographics | Rating | Rank | Single Father Poverty |
| Immigrants | Cabo Verde | 1.6 /100 | #243 | Tragic 17.0% |
| Hondurans | 1.6 /100 | #244 | Tragic 17.0% |
| Trinidadians and Tobagonians | 1.5 /100 | #245 | Tragic 17.0% |
| Immigrants | Ireland | 1.4 /100 | #246 | Tragic 17.1% |
| Greeks | 1.3 /100 | #247 | Tragic 17.1% |
| Czechoslovakians | 1.3 /100 | #248 | Tragic 17.1% |
| Canadians | 1.3 /100 | #249 | Tragic 17.1% |
| Austrians | 1.1 /100 | #250 | Tragic 17.1% |
| Luxembourgers | 1.1 /100 | #251 | Tragic 17.1% |
| Croatians | 1.0 /100 | #252 | Tragic 17.1% |
| Cree | 1.0 /100 | #253 | Tragic 17.1% |
| Immigrants | Honduras | 0.9 /100 | #254 | Tragic 17.1% |
| Sierra Leoneans | 0.8 /100 | #255 | Tragic 17.2% |
| Immigrants | Haiti | 0.8 /100 | #256 | Tragic 17.2% |
| Immigrants | Albania | 0.7 /100 | #257 | Tragic 17.2% |
Demographics Similar to Immigrants from Norway by Single Father Poverty
In terms of single father poverty, the demographic groups most similar to Immigrants from Norway are Menominee (16.8%, a difference of 0.020%), Hispanic or Latino (16.8%, a difference of 0.070%), Immigrants from Austria (16.8%, a difference of 0.080%), British (16.8%, a difference of 0.16%), and Belgian (16.8%, a difference of 0.23%).
| Demographics | Rating | Rank | Single Father Poverty |
| Cheyenne | 9.3 /100 | #217 | Tragic 16.7% |
| Immigrants | Uganda | 8.6 /100 | #218 | Tragic 16.7% |
| Immigrants | Ghana | 8.1 /100 | #219 | Tragic 16.7% |
| Immigrants | Denmark | 8.1 /100 | #220 | Tragic 16.7% |
| Immigrants | Greece | 8.1 /100 | #221 | Tragic 16.7% |
| Immigrants | Spain | 8.0 /100 | #222 | Tragic 16.7% |
| Immigrants | Austria | 7.0 /100 | #223 | Tragic 16.8% |
| Immigrants | Norway | 6.5 /100 | #224 | Tragic 16.8% |
| Menominee | 6.4 /100 | #225 | Tragic 16.8% |
| Hispanics or Latinos | 6.1 /100 | #226 | Tragic 16.8% |
| British | 5.6 /100 | #227 | Tragic 16.8% |
| Belgians | 5.3 /100 | #228 | Tragic 16.8% |
| Israelis | 4.6 /100 | #229 | Tragic 16.8% |
| Immigrants | Trinidad and Tobago | 4.5 /100 | #230 | Tragic 16.8% |
| Spanish Americans | 3.7 /100 | #231 | Tragic 16.9% |