Syrian vs Immigrants from Norway Single Father Poverty
COMPARE
Syrian
Immigrants from Norway
Single Father Poverty
Single Father Poverty Comparison
Syrians
Immigrants from Norway
16.6%
SINGLE FATHER POVERTY
17.4/ 100
METRIC RATING
200th/ 347
METRIC RANK
16.8%
SINGLE FATHER POVERTY
6.5/ 100
METRIC RATING
224th/ 347
METRIC RANK
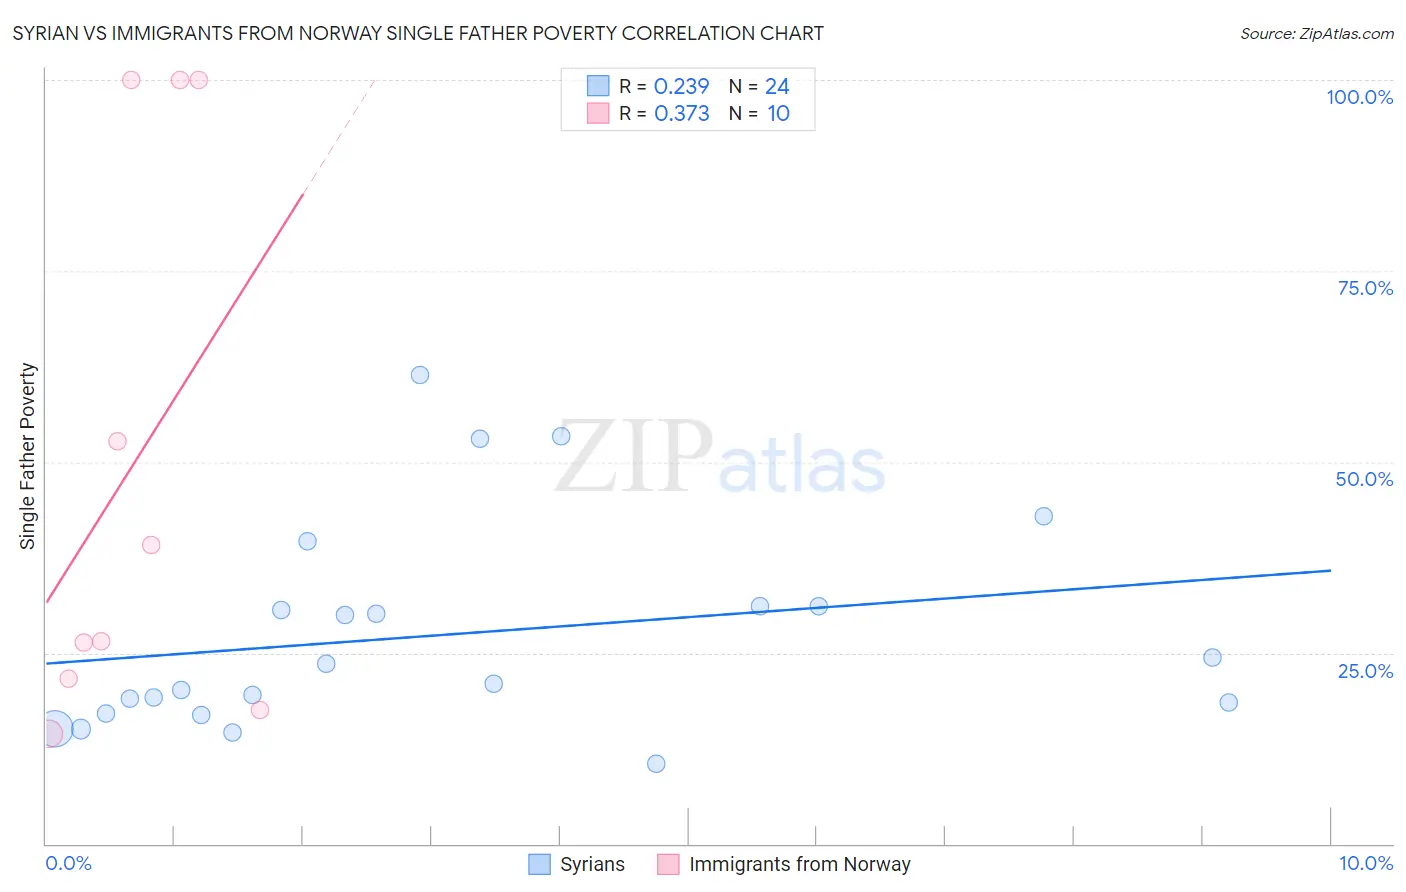
Syrian vs Immigrants from Norway Single Father Poverty Correlation Chart
The statistical analysis conducted on geographies consisting of 216,304,035 people shows a weak positive correlation between the proportion of Syrians and poverty level among single fathers in the United States with a correlation coefficient (R) of 0.239 and weighted average of 16.6%. Similarly, the statistical analysis conducted on geographies consisting of 101,345,089 people shows a mild positive correlation between the proportion of Immigrants from Norway and poverty level among single fathers in the United States with a correlation coefficient (R) of 0.373 and weighted average of 16.8%, a difference of 1.2%.
Single Father Poverty Correlation Summary
| Measurement | Syrian | Immigrants from Norway |
| Minimum | 10.4% | 14.5% |
| Maximum | 61.3% | 100.0% |
| Range | 50.9% | 85.5% |
| Mean | 27.4% | 49.8% |
| Median | 22.2% | 32.8% |
| Interquartile 25% (IQ1) | 17.7% | 21.6% |
| Interquartile 75% (IQ3) | 31.0% | 100.0% |
| Interquartile Range (IQR) | 13.3% | 78.4% |
| Standard Deviation (Sample) | 13.7% | 36.3% |
| Standard Deviation (Population) | 13.4% | 34.4% |
Similar Demographics by Single Father Poverty
Demographics Similar to Syrians by Single Father Poverty
In terms of single father poverty, the demographic groups most similar to Syrians are Cuban (16.6%, a difference of 0.070%), Immigrants from Croatia (16.6%, a difference of 0.070%), Immigrants from Belize (16.5%, a difference of 0.17%), Romanian (16.5%, a difference of 0.19%), and Immigrants from North America (16.6%, a difference of 0.19%).
| Demographics | Rating | Rank | Single Father Poverty |
| Ecuadorians | 24.5 /100 | #193 | Fair 16.5% |
| Cape Verdeans | 24.4 /100 | #194 | Fair 16.5% |
| Immigrants | Barbados | 24.3 /100 | #195 | Fair 16.5% |
| Immigrants | Canada | 21.9 /100 | #196 | Fair 16.5% |
| Immigrants | Northern Europe | 20.3 /100 | #197 | Fair 16.5% |
| Romanians | 20.1 /100 | #198 | Fair 16.5% |
| Immigrants | Belize | 19.8 /100 | #199 | Poor 16.5% |
| Syrians | 17.4 /100 | #200 | Poor 16.6% |
| Cubans | 16.5 /100 | #201 | Poor 16.6% |
| Immigrants | Croatia | 16.5 /100 | #202 | Poor 16.6% |
| Immigrants | North America | 15.1 /100 | #203 | Poor 16.6% |
| Immigrants | Guatemala | 14.8 /100 | #204 | Poor 16.6% |
| Venezuelans | 14.3 /100 | #205 | Poor 16.6% |
| Immigrants | Senegal | 13.7 /100 | #206 | Poor 16.6% |
| New Zealanders | 13.7 /100 | #207 | Poor 16.6% |
Demographics Similar to Immigrants from Norway by Single Father Poverty
In terms of single father poverty, the demographic groups most similar to Immigrants from Norway are Menominee (16.8%, a difference of 0.020%), Hispanic or Latino (16.8%, a difference of 0.070%), Immigrants from Austria (16.8%, a difference of 0.080%), British (16.8%, a difference of 0.16%), and Belgian (16.8%, a difference of 0.23%).
| Demographics | Rating | Rank | Single Father Poverty |
| Cheyenne | 9.3 /100 | #217 | Tragic 16.7% |
| Immigrants | Uganda | 8.6 /100 | #218 | Tragic 16.7% |
| Immigrants | Ghana | 8.1 /100 | #219 | Tragic 16.7% |
| Immigrants | Denmark | 8.1 /100 | #220 | Tragic 16.7% |
| Immigrants | Greece | 8.1 /100 | #221 | Tragic 16.7% |
| Immigrants | Spain | 8.0 /100 | #222 | Tragic 16.7% |
| Immigrants | Austria | 7.0 /100 | #223 | Tragic 16.8% |
| Immigrants | Norway | 6.5 /100 | #224 | Tragic 16.8% |
| Menominee | 6.4 /100 | #225 | Tragic 16.8% |
| Hispanics or Latinos | 6.1 /100 | #226 | Tragic 16.8% |
| British | 5.6 /100 | #227 | Tragic 16.8% |
| Belgians | 5.3 /100 | #228 | Tragic 16.8% |
| Israelis | 4.6 /100 | #229 | Tragic 16.8% |
| Immigrants | Trinidad and Tobago | 4.5 /100 | #230 | Tragic 16.8% |
| Spanish Americans | 3.7 /100 | #231 | Tragic 16.9% |