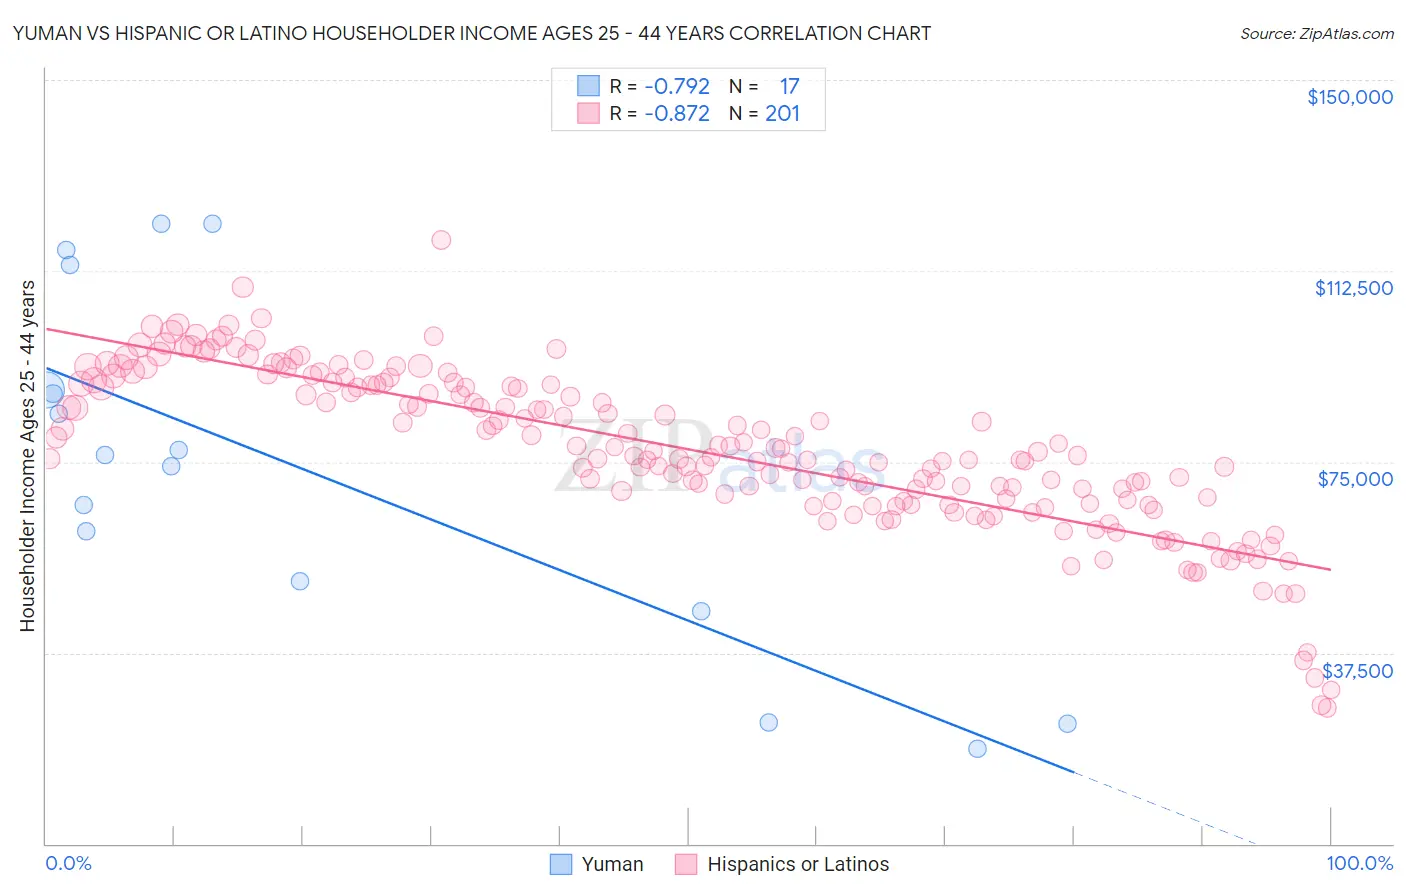
Yuman vs Hispanic or Latino Householder Income Ages 25 - 44 years
COMPARE
Yuman
Hispanic or Latino
Householder Income Ages 25 - 44 years
Householder Income Ages 25 - 44 years Comparison
Yuman
Hispanics or Latinos
$72,956
HOUSEHOLDER INCOME AGES 25 - 44 YEARS
0.0/ 100
METRIC RATING
339th/ 347
METRIC RANK
$80,515
HOUSEHOLDER INCOME AGES 25 - 44 YEARS
0.0/ 100
METRIC RATING
302nd/ 347
METRIC RANK
Yuman vs Hispanic or Latino Householder Income Ages 25 - 44 years Correlation Chart
The statistical analysis conducted on geographies consisting of 40,597,364 people shows a strong negative correlation between the proportion of Yuman and household income with householder between the ages 25 and 44 in the United States with a correlation coefficient (R) of -0.792 and weighted average of $72,956. Similarly, the statistical analysis conducted on geographies consisting of 571,919,072 people shows a very strong negative correlation between the proportion of Hispanics or Latinos and household income with householder between the ages 25 and 44 in the United States with a correlation coefficient (R) of -0.872 and weighted average of $80,515, a difference of 10.4%.
Householder Income Ages 25 - 44 years Correlation Summary
| Measurement | Yuman | Hispanic or Latino |
| Minimum | $18,542 | $26,720 |
| Maximum | $121,667 | $118,587 |
| Range | $103,125 | $91,867 |
| Mean | $73,782 | $77,340 |
| Median | $76,250 | $76,240 |
| Interquartile 25% (IQ1) | $48,591 | $67,336 |
| Interquartile 75% (IQ3) | $101,410 | $90,103 |
| Interquartile Range (IQR) | $52,819 | $22,768 |
| Standard Deviation (Sample) | $33,681 | $15,776 |
| Standard Deviation (Population) | $32,676 | $15,737 |
Similar Demographics by Householder Income Ages 25 - 44 years
Demographics Similar to Yuman by Householder Income Ages 25 - 44 years
In terms of householder income ages 25 - 44 years, the demographic groups most similar to Yuman are Immigrants from Yemen ($73,043, a difference of 0.12%), Black/African American ($73,370, a difference of 0.57%), Yup'ik ($73,688, a difference of 1.0%), Immigrants from Congo ($72,178, a difference of 1.1%), and Arapaho ($71,697, a difference of 1.8%).
| Demographics | Rating | Rank | Householder Income Ages 25 - 44 years |
| Bahamians | 0.0 /100 | #332 | Tragic $75,395 |
| Hopi | 0.0 /100 | #333 | Tragic $75,002 |
| Creek | 0.0 /100 | #334 | Tragic $74,847 |
| Kiowa | 0.0 /100 | #335 | Tragic $74,776 |
| Yup'ik | 0.0 /100 | #336 | Tragic $73,688 |
| Blacks/African Americans | 0.0 /100 | #337 | Tragic $73,370 |
| Immigrants | Yemen | 0.0 /100 | #338 | Tragic $73,043 |
| Yuman | 0.0 /100 | #339 | Tragic $72,956 |
| Immigrants | Congo | 0.0 /100 | #340 | Tragic $72,178 |
| Arapaho | 0.0 /100 | #341 | Tragic $71,697 |
| Crow | 0.0 /100 | #342 | Tragic $71,337 |
| Tohono O'odham | 0.0 /100 | #343 | Tragic $69,068 |
| Pueblo | 0.0 /100 | #344 | Tragic $68,910 |
| Navajo | 0.0 /100 | #345 | Tragic $66,529 |
| Puerto Ricans | 0.0 /100 | #346 | Tragic $65,996 |
Demographics Similar to Hispanics or Latinos by Householder Income Ages 25 - 44 years
In terms of householder income ages 25 - 44 years, the demographic groups most similar to Hispanics or Latinos are Immigrants from Micronesia ($80,544, a difference of 0.040%), Mexican ($80,427, a difference of 0.11%), Immigrants from Caribbean ($80,326, a difference of 0.24%), Immigrants from Dominican Republic ($80,319, a difference of 0.24%), and Apache ($80,260, a difference of 0.32%).
| Demographics | Rating | Rank | Householder Income Ages 25 - 44 years |
| Bangladeshis | 0.1 /100 | #295 | Tragic $81,363 |
| Immigrants | Dominica | 0.1 /100 | #296 | Tragic $81,351 |
| Immigrants | Guatemala | 0.1 /100 | #297 | Tragic $81,341 |
| Dominicans | 0.1 /100 | #298 | Tragic $81,229 |
| Immigrants | Liberia | 0.1 /100 | #299 | Tragic $80,863 |
| Cherokee | 0.0 /100 | #300 | Tragic $80,843 |
| Immigrants | Micronesia | 0.0 /100 | #301 | Tragic $80,544 |
| Hispanics or Latinos | 0.0 /100 | #302 | Tragic $80,515 |
| Mexicans | 0.0 /100 | #303 | Tragic $80,427 |
| Immigrants | Caribbean | 0.0 /100 | #304 | Tragic $80,326 |
| Immigrants | Dominican Republic | 0.0 /100 | #305 | Tragic $80,319 |
| Apache | 0.0 /100 | #306 | Tragic $80,260 |
| Haitians | 0.0 /100 | #307 | Tragic $80,055 |
| Immigrants | Central America | 0.0 /100 | #308 | Tragic $80,012 |
| Chippewa | 0.0 /100 | #309 | Tragic $80,005 |