Austrian vs White/Caucasian Family Poverty
COMPARE
Austrian
White/Caucasian
Family Poverty
Family Poverty Comparison
Austrians
Whites/Caucasians
7.8%
FAMILY POVERTY
98.2/ 100
METRIC RATING
73rd/ 347
METRIC RANK
8.8%
FAMILY POVERTY
69.1/ 100
METRIC RATING
158th/ 347
METRIC RANK
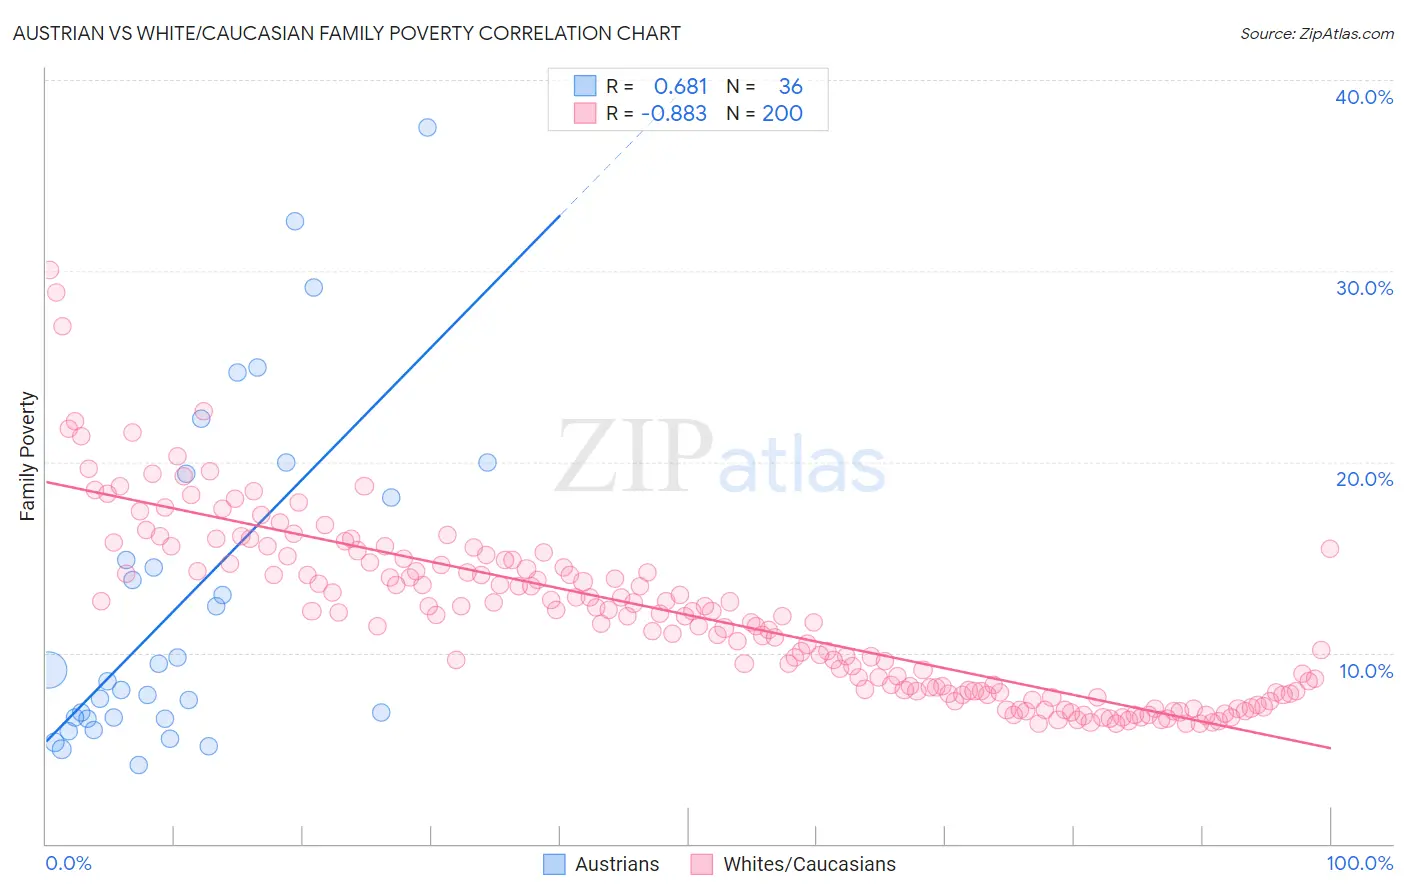
Austrian vs White/Caucasian Family Poverty Correlation Chart
The statistical analysis conducted on geographies consisting of 450,050,339 people shows a significant positive correlation between the proportion of Austrians and poverty level among families in the United States with a correlation coefficient (R) of 0.681 and weighted average of 7.8%. Similarly, the statistical analysis conducted on geographies consisting of 578,762,373 people shows a very strong negative correlation between the proportion of Whites/Caucasians and poverty level among families in the United States with a correlation coefficient (R) of -0.883 and weighted average of 8.8%, a difference of 12.0%.
Family Poverty Correlation Summary
| Measurement | Austrian | White/Caucasian |
| Minimum | 4.1% | 6.3% |
| Maximum | 37.5% | 30.1% |
| Range | 33.4% | 23.8% |
| Mean | 12.8% | 12.0% |
| Median | 8.8% | 11.9% |
| Interquartile 25% (IQ1) | 6.6% | 7.9% |
| Interquartile 75% (IQ3) | 18.8% | 14.7% |
| Interquartile Range (IQR) | 12.2% | 6.7% |
| Standard Deviation (Sample) | 8.6% | 4.6% |
| Standard Deviation (Population) | 8.5% | 4.6% |
Similar Demographics by Family Poverty
Demographics Similar to Austrians by Family Poverty
In terms of family poverty, the demographic groups most similar to Austrians are Immigrants from Romania (7.8%, a difference of 0.0%), Cambodian (7.8%, a difference of 0.060%), Immigrants from China (7.8%, a difference of 0.070%), Immigrants from Canada (7.8%, a difference of 0.080%), and Immigrants from Belgium (7.8%, a difference of 0.13%).
| Demographics | Rating | Rank | Family Poverty |
| Dutch | 98.3 /100 | #66 | Exceptional 7.8% |
| Northern Europeans | 98.3 /100 | #67 | Exceptional 7.8% |
| Australians | 98.2 /100 | #68 | Exceptional 7.8% |
| Immigrants | Belgium | 98.2 /100 | #69 | Exceptional 7.8% |
| Immigrants | Canada | 98.2 /100 | #70 | Exceptional 7.8% |
| Cambodians | 98.2 /100 | #71 | Exceptional 7.8% |
| Immigrants | Romania | 98.2 /100 | #72 | Exceptional 7.8% |
| Austrians | 98.2 /100 | #73 | Exceptional 7.8% |
| Immigrants | China | 98.1 /100 | #74 | Exceptional 7.8% |
| Immigrants | Croatia | 98.1 /100 | #75 | Exceptional 7.8% |
| Immigrants | Latvia | 98.0 /100 | #76 | Exceptional 7.9% |
| Ukrainians | 98.0 /100 | #77 | Exceptional 7.9% |
| Immigrants | North America | 97.9 /100 | #78 | Exceptional 7.9% |
| Immigrants | Europe | 97.8 /100 | #79 | Exceptional 7.9% |
| English | 97.8 /100 | #80 | Exceptional 7.9% |
Demographics Similar to Whites/Caucasians by Family Poverty
In terms of family poverty, the demographic groups most similar to Whites/Caucasians are Tsimshian (8.8%, a difference of 0.040%), Peruvian (8.8%, a difference of 0.16%), Hungarian (8.8%, a difference of 0.30%), Immigrants from Northern Africa (8.8%, a difference of 0.33%), and Immigrants from Oceania (8.7%, a difference of 0.34%).
| Demographics | Rating | Rank | Family Poverty |
| Brazilians | 80.1 /100 | #151 | Excellent 8.6% |
| Samoans | 79.8 /100 | #152 | Good 8.6% |
| Immigrants | Spain | 79.1 /100 | #153 | Good 8.6% |
| Immigrants | Vietnam | 75.4 /100 | #154 | Good 8.7% |
| Immigrants | Kuwait | 73.6 /100 | #155 | Good 8.7% |
| Immigrants | Oceania | 71.2 /100 | #156 | Good 8.7% |
| Tsimshian | 69.3 /100 | #157 | Good 8.8% |
| Whites/Caucasians | 69.1 /100 | #158 | Good 8.8% |
| Peruvians | 68.0 /100 | #159 | Good 8.8% |
| Hungarians | 67.2 /100 | #160 | Good 8.8% |
| Immigrants | Northern Africa | 66.9 /100 | #161 | Good 8.8% |
| Ethiopians | 66.3 /100 | #162 | Good 8.8% |
| Pennsylvania Germans | 66.0 /100 | #163 | Good 8.8% |
| Celtics | 64.9 /100 | #164 | Good 8.8% |
| Guamanians/Chamorros | 64.7 /100 | #165 | Good 8.8% |