Immigrants from Sudan vs White/Caucasian Family Poverty
COMPARE
Immigrants from Sudan
White/Caucasian
Family Poverty
Family Poverty Comparison
Immigrants from Sudan
Whites/Caucasians
10.1%
FAMILY POVERTY
2.3/ 100
METRIC RATING
232nd/ 347
METRIC RANK
8.8%
FAMILY POVERTY
69.1/ 100
METRIC RATING
158th/ 347
METRIC RANK
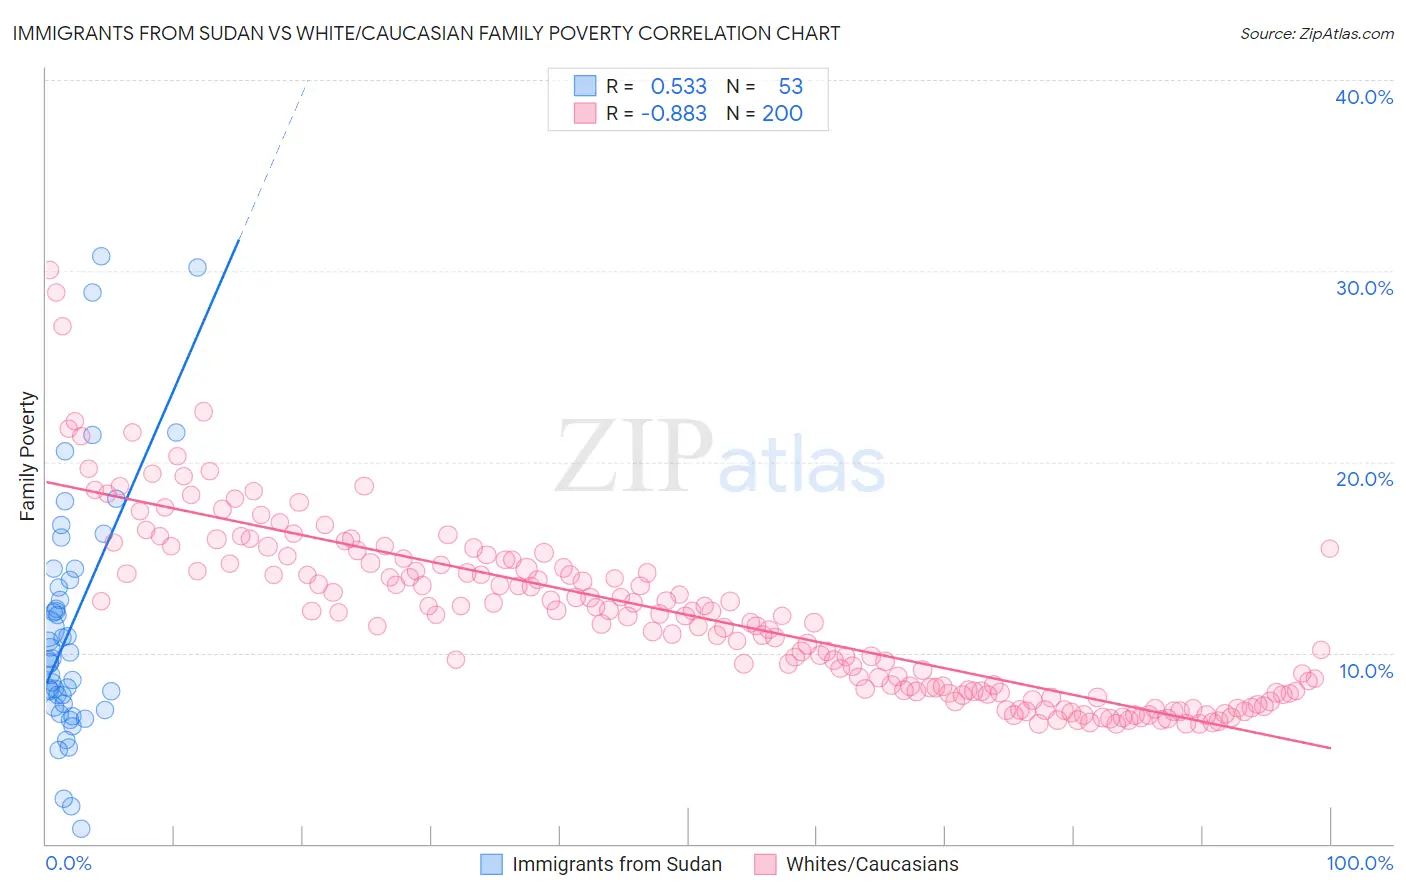
Immigrants from Sudan vs White/Caucasian Family Poverty Correlation Chart
The statistical analysis conducted on geographies consisting of 118,923,711 people shows a substantial positive correlation between the proportion of Immigrants from Sudan and poverty level among families in the United States with a correlation coefficient (R) of 0.533 and weighted average of 10.1%. Similarly, the statistical analysis conducted on geographies consisting of 578,762,373 people shows a very strong negative correlation between the proportion of Whites/Caucasians and poverty level among families in the United States with a correlation coefficient (R) of -0.883 and weighted average of 8.8%, a difference of 15.3%.
Family Poverty Correlation Summary
| Measurement | Immigrants from Sudan | White/Caucasian |
| Minimum | 0.80% | 6.3% |
| Maximum | 30.8% | 30.1% |
| Range | 30.0% | 23.8% |
| Mean | 11.4% | 12.0% |
| Median | 9.7% | 11.9% |
| Interquartile 25% (IQ1) | 7.3% | 7.9% |
| Interquartile 75% (IQ3) | 14.1% | 14.7% |
| Interquartile Range (IQR) | 6.9% | 6.7% |
| Standard Deviation (Sample) | 6.5% | 4.6% |
| Standard Deviation (Population) | 6.4% | 4.6% |
Similar Demographics by Family Poverty
Demographics Similar to Immigrants from Sudan by Family Poverty
In terms of family poverty, the demographic groups most similar to Immigrants from Sudan are Fijian (10.1%, a difference of 0.25%), Immigrants from Middle Africa (10.1%, a difference of 0.36%), Nigerian (10.1%, a difference of 0.39%), Alaskan Athabascan (10.1%, a difference of 0.43%), and Immigrants from Nigeria (10.2%, a difference of 0.64%).
| Demographics | Rating | Rank | Family Poverty |
| Immigrants | Immigrants | 3.6 /100 | #225 | Tragic 10.0% |
| Ottawa | 3.3 /100 | #226 | Tragic 10.0% |
| Immigrants | Armenia | 3.3 /100 | #227 | Tragic 10.0% |
| Sudanese | 3.1 /100 | #228 | Tragic 10.0% |
| Immigrants | Uzbekistan | 3.1 /100 | #229 | Tragic 10.0% |
| Immigrants | Panama | 3.1 /100 | #230 | Tragic 10.0% |
| Alaskan Athabascans | 2.7 /100 | #231 | Tragic 10.1% |
| Immigrants | Sudan | 2.3 /100 | #232 | Tragic 10.1% |
| Fijians | 2.1 /100 | #233 | Tragic 10.1% |
| Immigrants | Middle Africa | 2.1 /100 | #234 | Tragic 10.1% |
| Nigerians | 2.0 /100 | #235 | Tragic 10.1% |
| Immigrants | Nigeria | 1.9 /100 | #236 | Tragic 10.2% |
| Immigrants | Laos | 1.7 /100 | #237 | Tragic 10.2% |
| French American Indians | 1.5 /100 | #238 | Tragic 10.2% |
| Potawatomi | 1.5 /100 | #239 | Tragic 10.2% |
Demographics Similar to Whites/Caucasians by Family Poverty
In terms of family poverty, the demographic groups most similar to Whites/Caucasians are Tsimshian (8.8%, a difference of 0.040%), Peruvian (8.8%, a difference of 0.16%), Hungarian (8.8%, a difference of 0.30%), Immigrants from Northern Africa (8.8%, a difference of 0.33%), and Immigrants from Oceania (8.7%, a difference of 0.34%).
| Demographics | Rating | Rank | Family Poverty |
| Brazilians | 80.1 /100 | #151 | Excellent 8.6% |
| Samoans | 79.8 /100 | #152 | Good 8.6% |
| Immigrants | Spain | 79.1 /100 | #153 | Good 8.6% |
| Immigrants | Vietnam | 75.4 /100 | #154 | Good 8.7% |
| Immigrants | Kuwait | 73.6 /100 | #155 | Good 8.7% |
| Immigrants | Oceania | 71.2 /100 | #156 | Good 8.7% |
| Tsimshian | 69.3 /100 | #157 | Good 8.8% |
| Whites/Caucasians | 69.1 /100 | #158 | Good 8.8% |
| Peruvians | 68.0 /100 | #159 | Good 8.8% |
| Hungarians | 67.2 /100 | #160 | Good 8.8% |
| Immigrants | Northern Africa | 66.9 /100 | #161 | Good 8.8% |
| Ethiopians | 66.3 /100 | #162 | Good 8.8% |
| Pennsylvania Germans | 66.0 /100 | #163 | Good 8.8% |
| Celtics | 64.9 /100 | #164 | Good 8.8% |
| Guamanians/Chamorros | 64.7 /100 | #165 | Good 8.8% |