Yugoslavian vs White/Caucasian Self-Care Disability
COMPARE
Yugoslavian
White/Caucasian
Self-Care Disability
Self-Care Disability Comparison
Yugoslavians
Whites/Caucasians
2.5%
SELF-CARE DISABILITY
36.1/ 100
METRIC RATING
184th/ 347
METRIC RANK
2.6%
SELF-CARE DISABILITY
4.4/ 100
METRIC RATING
216th/ 347
METRIC RANK
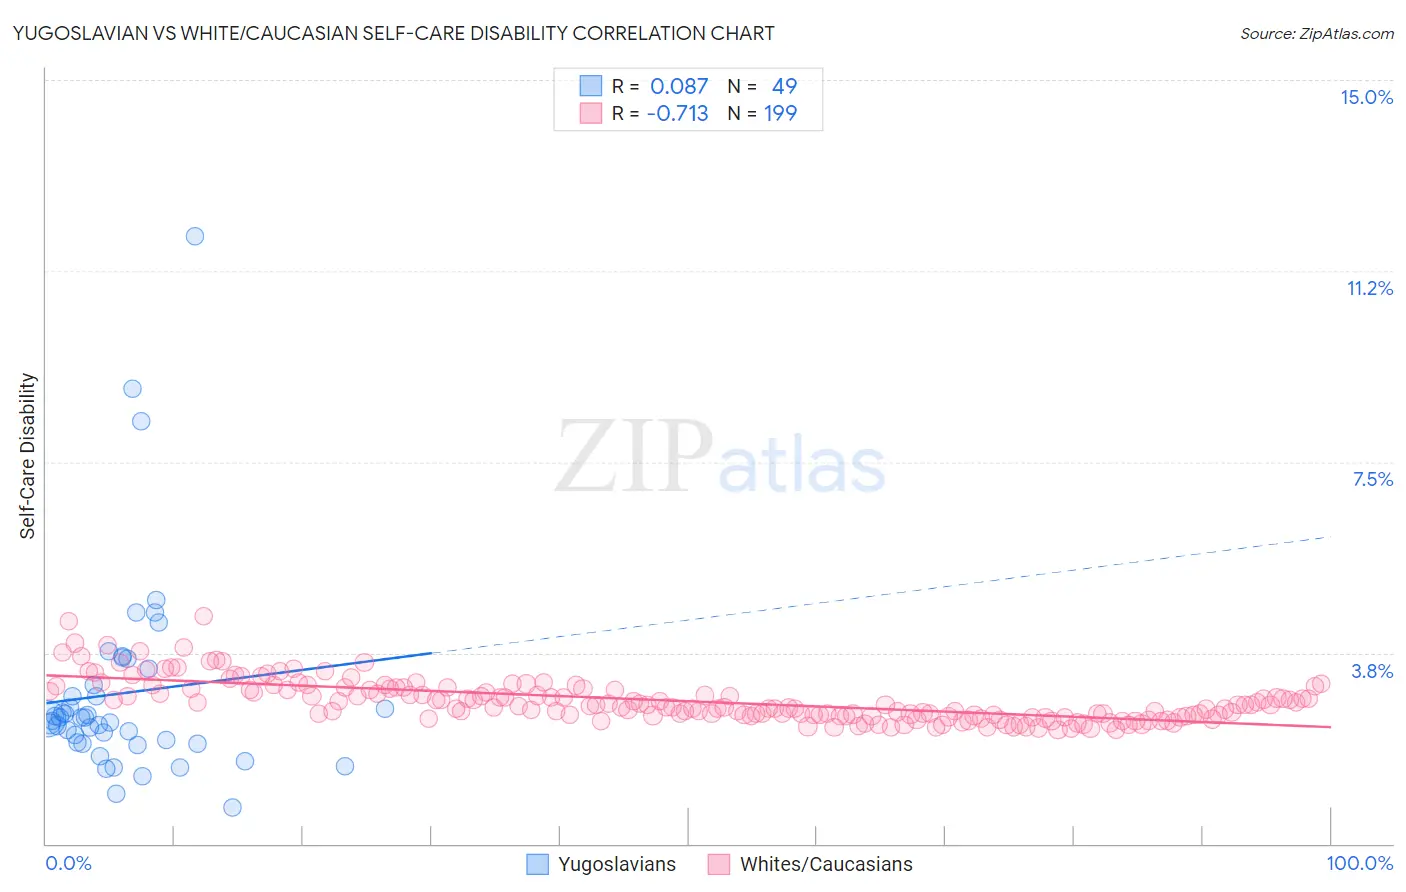
Yugoslavian vs White/Caucasian Self-Care Disability Correlation Chart
The statistical analysis conducted on geographies consisting of 285,516,060 people shows a slight positive correlation between the proportion of Yugoslavians and percentage of population with self-care disability in the United States with a correlation coefficient (R) of 0.087 and weighted average of 2.5%. Similarly, the statistical analysis conducted on geographies consisting of 580,250,955 people shows a strong negative correlation between the proportion of Whites/Caucasians and percentage of population with self-care disability in the United States with a correlation coefficient (R) of -0.713 and weighted average of 2.6%, a difference of 3.0%.
Self-Care Disability Correlation Summary
| Measurement | Yugoslavian | White/Caucasian |
| Minimum | 0.70% | 2.2% |
| Maximum | 11.9% | 4.5% |
| Range | 11.2% | 2.2% |
| Mean | 3.0% | 2.8% |
| Median | 2.5% | 2.7% |
| Interquartile 25% (IQ1) | 2.0% | 2.5% |
| Interquartile 75% (IQ3) | 3.3% | 3.0% |
| Interquartile Range (IQR) | 1.3% | 0.53% |
| Standard Deviation (Sample) | 2.0% | 0.41% |
| Standard Deviation (Population) | 2.0% | 0.41% |
Similar Demographics by Self-Care Disability
Demographics Similar to Yugoslavians by Self-Care Disability
In terms of self-care disability, the demographic groups most similar to Yugoslavians are Salvadoran (2.5%, a difference of 0.020%), Maltese (2.5%, a difference of 0.070%), Slavic (2.5%, a difference of 0.090%), Immigrants from El Salvador (2.5%, a difference of 0.17%), and Ghanaian (2.5%, a difference of 0.21%).
| Demographics | Rating | Rank | Self-Care Disability |
| Immigrants | Kazakhstan | 46.7 /100 | #177 | Average 2.5% |
| English | 46.2 /100 | #178 | Average 2.5% |
| Hungarians | 45.5 /100 | #179 | Average 2.5% |
| Indonesians | 41.2 /100 | #180 | Average 2.5% |
| Ghanaians | 40.4 /100 | #181 | Average 2.5% |
| Maltese | 37.5 /100 | #182 | Fair 2.5% |
| Salvadorans | 36.4 /100 | #183 | Fair 2.5% |
| Yugoslavians | 36.1 /100 | #184 | Fair 2.5% |
| Slavs | 34.3 /100 | #185 | Fair 2.5% |
| Immigrants | El Salvador | 33.0 /100 | #186 | Fair 2.5% |
| Irish | 28.7 /100 | #187 | Fair 2.5% |
| Immigrants | Oceania | 28.3 /100 | #188 | Fair 2.5% |
| Immigrants | Eastern Europe | 28.0 /100 | #189 | Fair 2.5% |
| Sioux | 24.6 /100 | #190 | Fair 2.5% |
| Moroccans | 22.9 /100 | #191 | Fair 2.5% |
Demographics Similar to Whites/Caucasians by Self-Care Disability
In terms of self-care disability, the demographic groups most similar to Whites/Caucasians are Immigrants from Thailand (2.6%, a difference of 0.020%), Celtic (2.6%, a difference of 0.020%), Ecuadorian (2.6%, a difference of 0.070%), Immigrants from Honduras (2.6%, a difference of 0.070%), and Scotch-Irish (2.6%, a difference of 0.090%).
| Demographics | Rating | Rank | Self-Care Disability |
| Malaysians | 7.7 /100 | #209 | Tragic 2.5% |
| Panamanians | 6.4 /100 | #210 | Tragic 2.5% |
| Native Hawaiians | 5.1 /100 | #211 | Tragic 2.6% |
| Samoans | 5.1 /100 | #212 | Tragic 2.6% |
| Ecuadorians | 4.7 /100 | #213 | Tragic 2.6% |
| Immigrants | Honduras | 4.7 /100 | #214 | Tragic 2.6% |
| Immigrants | Thailand | 4.5 /100 | #215 | Tragic 2.6% |
| Whites/Caucasians | 4.4 /100 | #216 | Tragic 2.6% |
| Celtics | 4.4 /100 | #217 | Tragic 2.6% |
| Scotch-Irish | 4.1 /100 | #218 | Tragic 2.6% |
| Immigrants | Moldova | 4.0 /100 | #219 | Tragic 2.6% |
| Sub-Saharan Africans | 4.0 /100 | #220 | Tragic 2.6% |
| Hondurans | 3.8 /100 | #221 | Tragic 2.6% |
| Spaniards | 3.8 /100 | #222 | Tragic 2.6% |
| French Canadians | 3.8 /100 | #223 | Tragic 2.6% |