Immigrants from Egypt vs Comanche Family Poverty
COMPARE
Immigrants from Egypt
Comanche
Family Poverty
Family Poverty Comparison
Immigrants from Egypt
Comanche
8.3%
FAMILY POVERTY
91.6/ 100
METRIC RATING
120th/ 347
METRIC RANK
11.0%
FAMILY POVERTY
0.1/ 100
METRIC RATING
267th/ 347
METRIC RANK
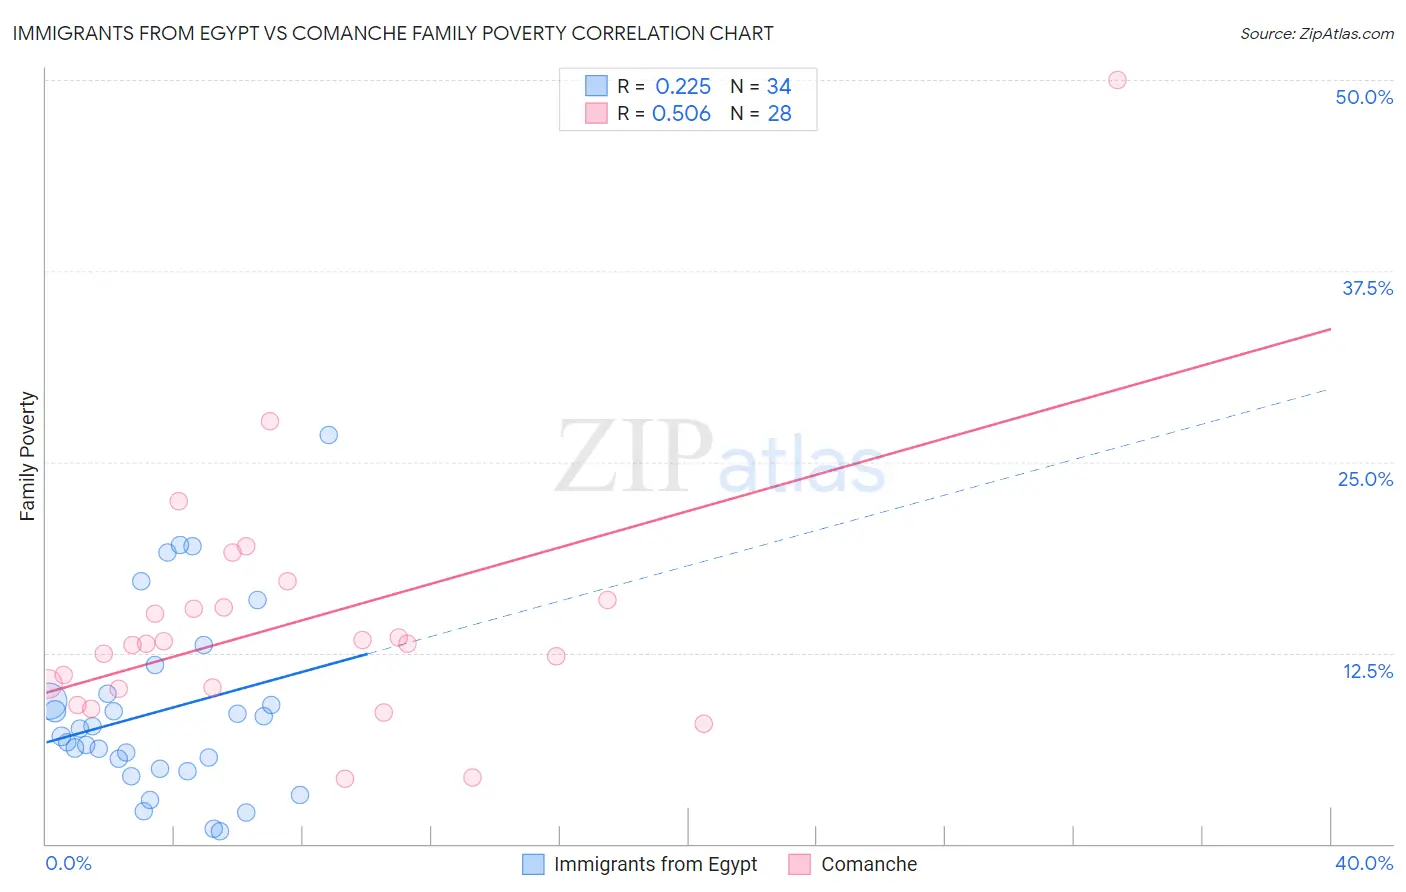
Immigrants from Egypt vs Comanche Family Poverty Correlation Chart
The statistical analysis conducted on geographies consisting of 245,176,811 people shows a weak positive correlation between the proportion of Immigrants from Egypt and poverty level among families in the United States with a correlation coefficient (R) of 0.225 and weighted average of 8.3%. Similarly, the statistical analysis conducted on geographies consisting of 109,722,823 people shows a substantial positive correlation between the proportion of Comanche and poverty level among families in the United States with a correlation coefficient (R) of 0.506 and weighted average of 11.0%, a difference of 33.1%.
Family Poverty Correlation Summary
| Measurement | Immigrants from Egypt | Comanche |
| Minimum | 0.80% | 4.3% |
| Maximum | 26.7% | 50.0% |
| Range | 25.9% | 45.7% |
| Mean | 8.7% | 14.5% |
| Median | 7.3% | 13.1% |
| Interquartile 25% (IQ1) | 4.9% | 10.2% |
| Interquartile 75% (IQ3) | 9.8% | 15.7% |
| Interquartile Range (IQR) | 4.9% | 5.5% |
| Standard Deviation (Sample) | 6.0% | 8.6% |
| Standard Deviation (Population) | 5.9% | 8.4% |
Similar Demographics by Family Poverty
Demographics Similar to Immigrants from Egypt by Family Poverty
In terms of family poverty, the demographic groups most similar to Immigrants from Egypt are Native Hawaiian (8.3%, a difference of 0.17%), Paraguayan (8.3%, a difference of 0.18%), Palestinian (8.3%, a difference of 0.25%), Soviet Union (8.3%, a difference of 0.35%), and Pakistani (8.3%, a difference of 0.39%).
| Demographics | Rating | Rank | Family Poverty |
| Canadians | 94.2 /100 | #113 | Exceptional 8.2% |
| Immigrants | Zimbabwe | 94.0 /100 | #114 | Exceptional 8.2% |
| Immigrants | Israel | 93.5 /100 | #115 | Exceptional 8.2% |
| South Africans | 93.4 /100 | #116 | Exceptional 8.2% |
| Immigrants | Russia | 93.2 /100 | #117 | Exceptional 8.2% |
| Immigrants | Western Europe | 92.9 /100 | #118 | Exceptional 8.2% |
| French | 92.8 /100 | #119 | Exceptional 8.3% |
| Immigrants | Egypt | 91.6 /100 | #120 | Exceptional 8.3% |
| Native Hawaiians | 91.3 /100 | #121 | Exceptional 8.3% |
| Paraguayans | 91.2 /100 | #122 | Exceptional 8.3% |
| Palestinians | 91.1 /100 | #123 | Exceptional 8.3% |
| Soviet Union | 90.8 /100 | #124 | Exceptional 8.3% |
| Pakistanis | 90.8 /100 | #125 | Exceptional 8.3% |
| Icelanders | 90.3 /100 | #126 | Exceptional 8.3% |
| Immigrants | Hungary | 89.9 /100 | #127 | Excellent 8.4% |
Demographics Similar to Comanche by Family Poverty
In terms of family poverty, the demographic groups most similar to Comanche are Immigrants from El Salvador (11.0%, a difference of 0.010%), Jamaican (11.1%, a difference of 0.10%), Immigrants from Ecuador (11.1%, a difference of 0.58%), Immigrants from Nicaragua (11.1%, a difference of 0.59%), and Immigrants from Bahamas (11.1%, a difference of 0.84%).
| Demographics | Rating | Rank | Family Poverty |
| Bangladeshis | 0.2 /100 | #260 | Tragic 10.9% |
| Shoshone | 0.2 /100 | #261 | Tragic 10.9% |
| Spanish American Indians | 0.2 /100 | #262 | Tragic 10.9% |
| Cape Verdeans | 0.1 /100 | #263 | Tragic 10.9% |
| Trinidadians and Tobagonians | 0.1 /100 | #264 | Tragic 10.9% |
| Immigrants | Trinidad and Tobago | 0.1 /100 | #265 | Tragic 10.9% |
| Immigrants | El Salvador | 0.1 /100 | #266 | Tragic 11.0% |
| Comanche | 0.1 /100 | #267 | Tragic 11.0% |
| Jamaicans | 0.1 /100 | #268 | Tragic 11.1% |
| Immigrants | Ecuador | 0.1 /100 | #269 | Tragic 11.1% |
| Immigrants | Nicaragua | 0.1 /100 | #270 | Tragic 11.1% |
| Immigrants | Bahamas | 0.1 /100 | #271 | Tragic 11.1% |
| Immigrants | Jamaica | 0.1 /100 | #272 | Tragic 11.2% |
| Somalis | 0.1 /100 | #273 | Tragic 11.2% |
| Spanish Americans | 0.1 /100 | #274 | Tragic 11.2% |