Yugoslavian vs Comanche Disability Age 65 to 74
COMPARE
Yugoslavian
Comanche
Disability Age 65 to 74
Disability Age 65 to 74 Comparison
Yugoslavians
Comanche
23.3%
DISABILITY AGE 65 TO 74
50.2/ 100
METRIC RATING
173rd/ 347
METRIC RANK
28.3%
DISABILITY AGE 65 TO 74
0.0/ 100
METRIC RATING
321st/ 347
METRIC RANK
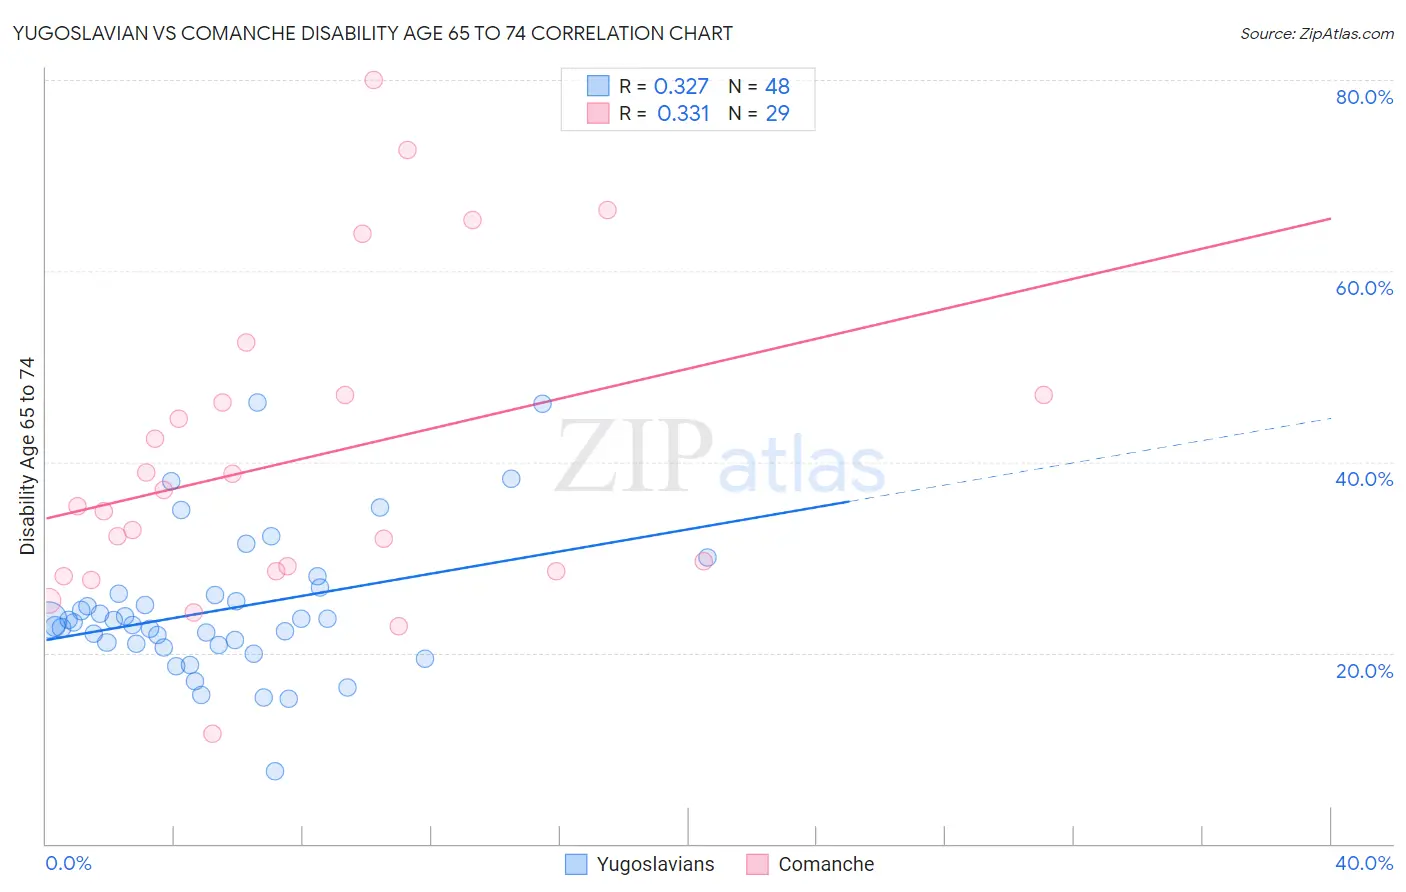
Yugoslavian vs Comanche Disability Age 65 to 74 Correlation Chart
The statistical analysis conducted on geographies consisting of 285,430,434 people shows a mild positive correlation between the proportion of Yugoslavians and percentage of population with a disability between the ages 65 and 75 in the United States with a correlation coefficient (R) of 0.327 and weighted average of 23.3%. Similarly, the statistical analysis conducted on geographies consisting of 109,698,765 people shows a mild positive correlation between the proportion of Comanche and percentage of population with a disability between the ages 65 and 75 in the United States with a correlation coefficient (R) of 0.331 and weighted average of 28.3%, a difference of 21.5%.
Disability Age 65 to 74 Correlation Summary
| Measurement | Yugoslavian | Comanche |
| Minimum | 7.5% | 11.6% |
| Maximum | 46.2% | 80.0% |
| Range | 38.7% | 68.4% |
| Mean | 24.5% | 40.2% |
| Median | 23.3% | 35.3% |
| Interquartile 25% (IQ1) | 20.9% | 28.6% |
| Interquartile 75% (IQ3) | 26.1% | 47.1% |
| Interquartile Range (IQR) | 5.2% | 18.5% |
| Standard Deviation (Sample) | 7.4% | 16.3% |
| Standard Deviation (Population) | 7.3% | 16.1% |
Similar Demographics by Disability Age 65 to 74
Demographics Similar to Yugoslavians by Disability Age 65 to 74
In terms of disability age 65 to 74, the demographic groups most similar to Yugoslavians are Immigrants from South Eastern Asia (23.3%, a difference of 0.010%), German (23.3%, a difference of 0.020%), Dutch (23.3%, a difference of 0.050%), Cuban (23.3%, a difference of 0.10%), and Immigrants from Eritrea (23.4%, a difference of 0.15%).
| Demographics | Rating | Rank | Disability Age 65 to 74 |
| Immigrants | Afghanistan | 60.5 /100 | #166 | Good 23.2% |
| Immigrants | Bosnia and Herzegovina | 57.6 /100 | #167 | Average 23.2% |
| Pakistanis | 57.0 /100 | #168 | Average 23.2% |
| Icelanders | 54.3 /100 | #169 | Average 23.3% |
| Moroccans | 54.2 /100 | #170 | Average 23.3% |
| Cubans | 51.9 /100 | #171 | Average 23.3% |
| Germans | 50.5 /100 | #172 | Average 23.3% |
| Yugoslavians | 50.2 /100 | #173 | Average 23.3% |
| Immigrants | South Eastern Asia | 50.0 /100 | #174 | Average 23.3% |
| Dutch | 49.4 /100 | #175 | Average 23.3% |
| Immigrants | Eritrea | 47.5 /100 | #176 | Average 23.4% |
| Immigrants | Haiti | 47.5 /100 | #177 | Average 23.4% |
| Guyanese | 45.8 /100 | #178 | Average 23.4% |
| Immigrants | Sierra Leone | 45.8 /100 | #179 | Average 23.4% |
| Scandinavians | 45.6 /100 | #180 | Average 23.4% |
Demographics Similar to Comanche by Disability Age 65 to 74
In terms of disability age 65 to 74, the demographic groups most similar to Comanche are Aleut (28.4%, a difference of 0.33%), Cherokee (28.2%, a difference of 0.51%), Arapaho (28.1%, a difference of 0.89%), Nepalese (28.0%, a difference of 1.1%), and Immigrants from Armenia (28.0%, a difference of 1.3%).
| Demographics | Rating | Rank | Disability Age 65 to 74 |
| Chippewa | 0.0 /100 | #314 | Tragic 27.8% |
| Cajuns | 0.0 /100 | #315 | Tragic 27.9% |
| Crow | 0.0 /100 | #316 | Tragic 27.9% |
| Immigrants | Armenia | 0.0 /100 | #317 | Tragic 28.0% |
| Nepalese | 0.0 /100 | #318 | Tragic 28.0% |
| Arapaho | 0.0 /100 | #319 | Tragic 28.1% |
| Cherokee | 0.0 /100 | #320 | Tragic 28.2% |
| Comanche | 0.0 /100 | #321 | Tragic 28.3% |
| Aleuts | 0.0 /100 | #322 | Tragic 28.4% |
| Puerto Ricans | 0.0 /100 | #323 | Tragic 29.1% |
| Seminole | 0.0 /100 | #324 | Tragic 29.4% |
| Dutch West Indians | 0.0 /100 | #325 | Tragic 29.6% |
| Yakama | 0.0 /100 | #326 | Tragic 29.6% |
| Apache | 0.0 /100 | #327 | Tragic 29.7% |
| Hopi | 0.0 /100 | #328 | Tragic 30.0% |