Indian (Asian) vs Comanche Family Poverty
COMPARE
Indian (Asian)
Comanche
Family Poverty
Family Poverty Comparison
Indians (Asian)
Comanche
7.7%
FAMILY POVERTY
98.8/ 100
METRIC RATING
52nd/ 347
METRIC RANK
11.0%
FAMILY POVERTY
0.1/ 100
METRIC RATING
267th/ 347
METRIC RANK
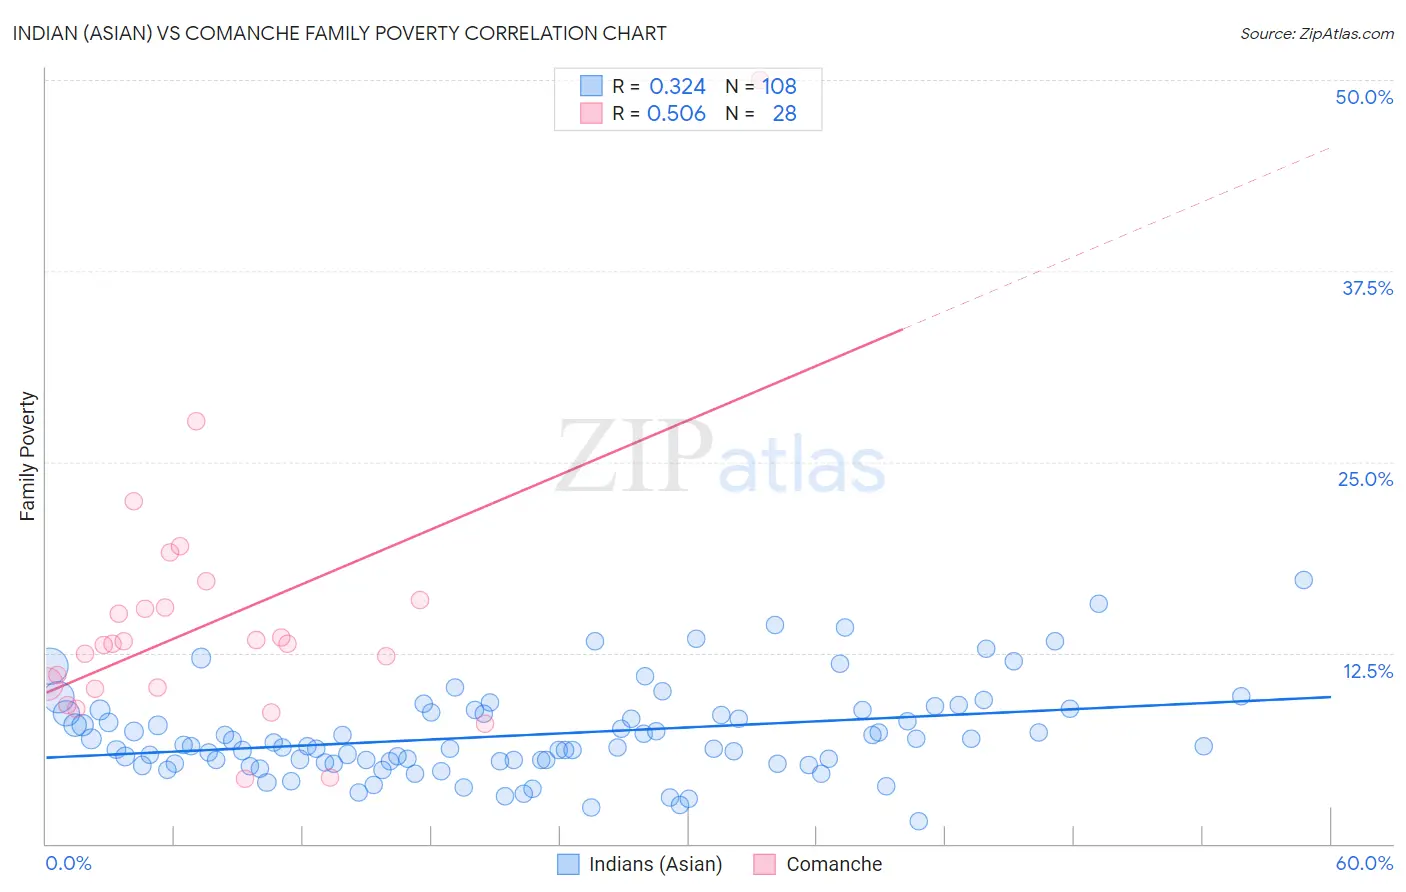
Indian (Asian) vs Comanche Family Poverty Correlation Chart
The statistical analysis conducted on geographies consisting of 492,769,708 people shows a mild positive correlation between the proportion of Indians (Asian) and poverty level among families in the United States with a correlation coefficient (R) of 0.324 and weighted average of 7.7%. Similarly, the statistical analysis conducted on geographies consisting of 109,722,823 people shows a substantial positive correlation between the proportion of Comanche and poverty level among families in the United States with a correlation coefficient (R) of 0.506 and weighted average of 11.0%, a difference of 43.3%.
Family Poverty Correlation Summary
| Measurement | Indian (Asian) | Comanche |
| Minimum | 1.5% | 4.3% |
| Maximum | 17.3% | 50.0% |
| Range | 15.8% | 45.7% |
| Mean | 7.1% | 14.5% |
| Median | 6.4% | 13.1% |
| Interquartile 25% (IQ1) | 5.4% | 10.2% |
| Interquartile 75% (IQ3) | 8.6% | 15.7% |
| Interquartile Range (IQR) | 3.2% | 5.5% |
| Standard Deviation (Sample) | 3.0% | 8.6% |
| Standard Deviation (Population) | 2.9% | 8.4% |
Similar Demographics by Family Poverty
Demographics Similar to Indians (Asian) by Family Poverty
In terms of family poverty, the demographic groups most similar to Indians (Asian) are Swiss (7.7%, a difference of 0.060%), Immigrants from Sweden (7.7%, a difference of 0.070%), Immigrants from Eastern Asia (7.7%, a difference of 0.10%), Immigrants from Serbia (7.7%, a difference of 0.14%), and Immigrants from Moldova (7.7%, a difference of 0.16%).
| Demographics | Rating | Rank | Family Poverty |
| Okinawans | 98.9 /100 | #45 | Exceptional 7.7% |
| Tongans | 98.9 /100 | #46 | Exceptional 7.7% |
| Immigrants | Czechoslovakia | 98.9 /100 | #47 | Exceptional 7.7% |
| Immigrants | Sri Lanka | 98.9 /100 | #48 | Exceptional 7.7% |
| Immigrants | Bolivia | 98.9 /100 | #49 | Exceptional 7.7% |
| Immigrants | North Macedonia | 98.9 /100 | #50 | Exceptional 7.7% |
| Immigrants | Moldova | 98.8 /100 | #51 | Exceptional 7.7% |
| Indians (Asian) | 98.8 /100 | #52 | Exceptional 7.7% |
| Swiss | 98.8 /100 | #53 | Exceptional 7.7% |
| Immigrants | Sweden | 98.8 /100 | #54 | Exceptional 7.7% |
| Immigrants | Eastern Asia | 98.7 /100 | #55 | Exceptional 7.7% |
| Immigrants | Serbia | 98.7 /100 | #56 | Exceptional 7.7% |
| Asians | 98.7 /100 | #57 | Exceptional 7.7% |
| Finns | 98.7 /100 | #58 | Exceptional 7.7% |
| Europeans | 98.7 /100 | #59 | Exceptional 7.7% |
Demographics Similar to Comanche by Family Poverty
In terms of family poverty, the demographic groups most similar to Comanche are Immigrants from El Salvador (11.0%, a difference of 0.010%), Jamaican (11.1%, a difference of 0.10%), Immigrants from Ecuador (11.1%, a difference of 0.58%), Immigrants from Nicaragua (11.1%, a difference of 0.59%), and Immigrants from Bahamas (11.1%, a difference of 0.84%).
| Demographics | Rating | Rank | Family Poverty |
| Bangladeshis | 0.2 /100 | #260 | Tragic 10.9% |
| Shoshone | 0.2 /100 | #261 | Tragic 10.9% |
| Spanish American Indians | 0.2 /100 | #262 | Tragic 10.9% |
| Cape Verdeans | 0.1 /100 | #263 | Tragic 10.9% |
| Trinidadians and Tobagonians | 0.1 /100 | #264 | Tragic 10.9% |
| Immigrants | Trinidad and Tobago | 0.1 /100 | #265 | Tragic 10.9% |
| Immigrants | El Salvador | 0.1 /100 | #266 | Tragic 11.0% |
| Comanche | 0.1 /100 | #267 | Tragic 11.0% |
| Jamaicans | 0.1 /100 | #268 | Tragic 11.1% |
| Immigrants | Ecuador | 0.1 /100 | #269 | Tragic 11.1% |
| Immigrants | Nicaragua | 0.1 /100 | #270 | Tragic 11.1% |
| Immigrants | Bahamas | 0.1 /100 | #271 | Tragic 11.1% |
| Immigrants | Jamaica | 0.1 /100 | #272 | Tragic 11.2% |
| Somalis | 0.1 /100 | #273 | Tragic 11.2% |
| Spanish Americans | 0.1 /100 | #274 | Tragic 11.2% |