Romanian vs Comanche Family Poverty
COMPARE
Romanian
Comanche
Family Poverty
Family Poverty Comparison
Romanians
Comanche
8.2%
FAMILY POVERTY
94.7/ 100
METRIC RATING
110th/ 347
METRIC RANK
11.0%
FAMILY POVERTY
0.1/ 100
METRIC RATING
267th/ 347
METRIC RANK
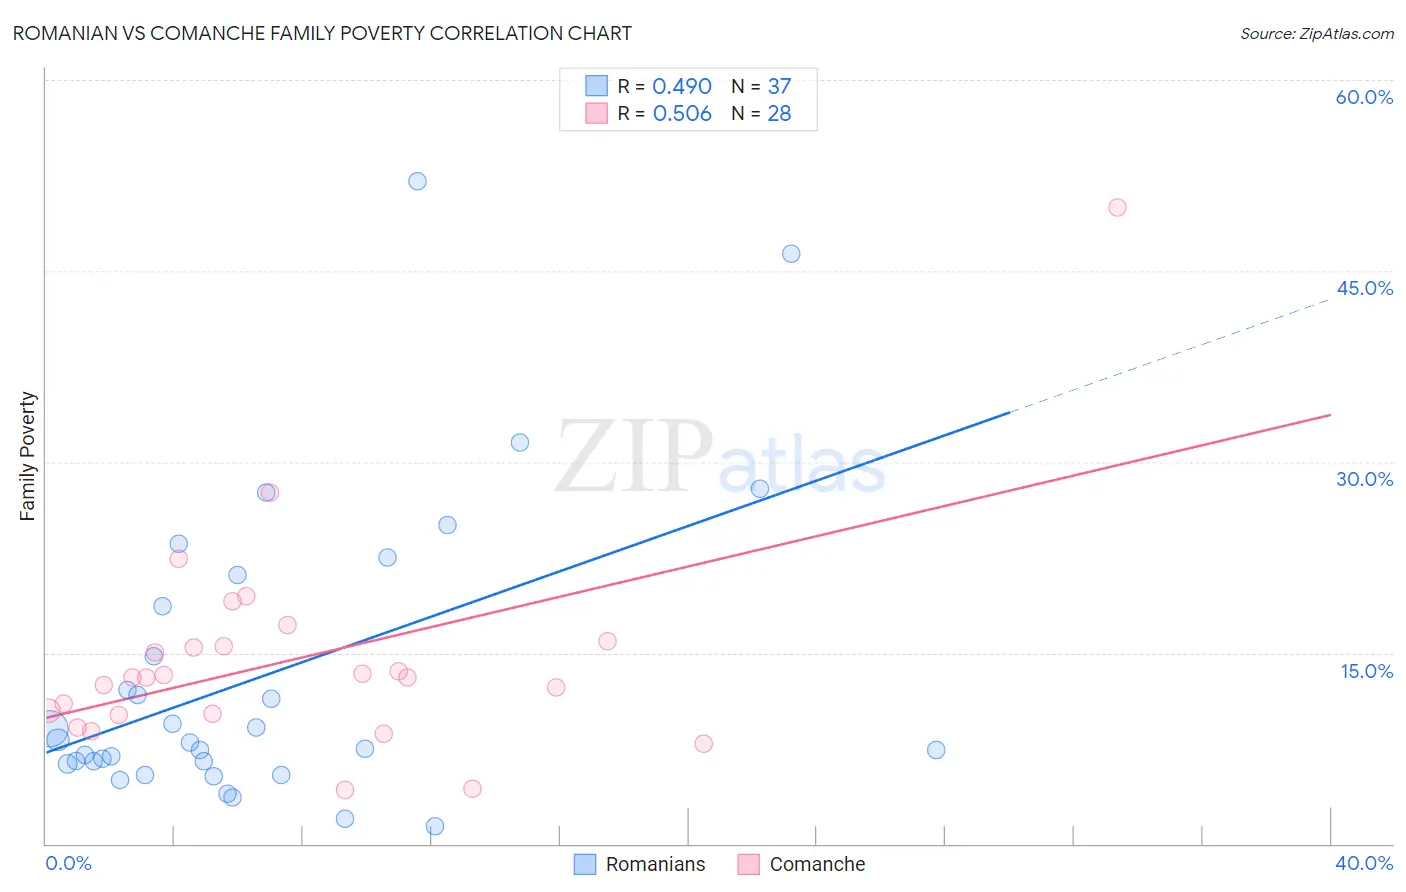
Romanian vs Comanche Family Poverty Correlation Chart
The statistical analysis conducted on geographies consisting of 376,889,400 people shows a moderate positive correlation between the proportion of Romanians and poverty level among families in the United States with a correlation coefficient (R) of 0.490 and weighted average of 8.2%. Similarly, the statistical analysis conducted on geographies consisting of 109,722,823 people shows a substantial positive correlation between the proportion of Comanche and poverty level among families in the United States with a correlation coefficient (R) of 0.506 and weighted average of 11.0%, a difference of 35.4%.
Family Poverty Correlation Summary
| Measurement | Romanian | Comanche |
| Minimum | 1.4% | 4.3% |
| Maximum | 52.0% | 50.0% |
| Range | 50.6% | 45.7% |
| Mean | 13.2% | 14.5% |
| Median | 7.9% | 13.1% |
| Interquartile 25% (IQ1) | 6.4% | 10.2% |
| Interquartile 75% (IQ3) | 19.9% | 15.7% |
| Interquartile Range (IQR) | 13.5% | 5.5% |
| Standard Deviation (Sample) | 11.8% | 8.6% |
| Standard Deviation (Population) | 11.6% | 8.4% |
Similar Demographics by Family Poverty
Demographics Similar to Romanians by Family Poverty
In terms of family poverty, the demographic groups most similar to Romanians are Taiwanese (8.2%, a difference of 0.060%), Jordanian (8.2%, a difference of 0.090%), Immigrants from France (8.2%, a difference of 0.16%), Basque (8.1%, a difference of 0.18%), and French Canadian (8.1%, a difference of 0.27%).
| Demographics | Rating | Rank | Family Poverty |
| Immigrants | Eastern Europe | 95.6 /100 | #103 | Exceptional 8.1% |
| Slavs | 95.6 /100 | #104 | Exceptional 8.1% |
| Laotians | 95.6 /100 | #105 | Exceptional 8.1% |
| Egyptians | 95.1 /100 | #106 | Exceptional 8.1% |
| French Canadians | 95.0 /100 | #107 | Exceptional 8.1% |
| Basques | 94.9 /100 | #108 | Exceptional 8.1% |
| Jordanians | 94.8 /100 | #109 | Exceptional 8.2% |
| Romanians | 94.7 /100 | #110 | Exceptional 8.2% |
| Taiwanese | 94.6 /100 | #111 | Exceptional 8.2% |
| Immigrants | France | 94.4 /100 | #112 | Exceptional 8.2% |
| Canadians | 94.2 /100 | #113 | Exceptional 8.2% |
| Immigrants | Zimbabwe | 94.0 /100 | #114 | Exceptional 8.2% |
| Immigrants | Israel | 93.5 /100 | #115 | Exceptional 8.2% |
| South Africans | 93.4 /100 | #116 | Exceptional 8.2% |
| Immigrants | Russia | 93.2 /100 | #117 | Exceptional 8.2% |
Demographics Similar to Comanche by Family Poverty
In terms of family poverty, the demographic groups most similar to Comanche are Immigrants from El Salvador (11.0%, a difference of 0.010%), Jamaican (11.1%, a difference of 0.10%), Immigrants from Ecuador (11.1%, a difference of 0.58%), Immigrants from Nicaragua (11.1%, a difference of 0.59%), and Immigrants from Bahamas (11.1%, a difference of 0.84%).
| Demographics | Rating | Rank | Family Poverty |
| Bangladeshis | 0.2 /100 | #260 | Tragic 10.9% |
| Shoshone | 0.2 /100 | #261 | Tragic 10.9% |
| Spanish American Indians | 0.2 /100 | #262 | Tragic 10.9% |
| Cape Verdeans | 0.1 /100 | #263 | Tragic 10.9% |
| Trinidadians and Tobagonians | 0.1 /100 | #264 | Tragic 10.9% |
| Immigrants | Trinidad and Tobago | 0.1 /100 | #265 | Tragic 10.9% |
| Immigrants | El Salvador | 0.1 /100 | #266 | Tragic 11.0% |
| Comanche | 0.1 /100 | #267 | Tragic 11.0% |
| Jamaicans | 0.1 /100 | #268 | Tragic 11.1% |
| Immigrants | Ecuador | 0.1 /100 | #269 | Tragic 11.1% |
| Immigrants | Nicaragua | 0.1 /100 | #270 | Tragic 11.1% |
| Immigrants | Bahamas | 0.1 /100 | #271 | Tragic 11.1% |
| Immigrants | Jamaica | 0.1 /100 | #272 | Tragic 11.2% |
| Somalis | 0.1 /100 | #273 | Tragic 11.2% |
| Spanish Americans | 0.1 /100 | #274 | Tragic 11.2% |