Yaqui vs Trinidadian and Tobagonian Male Poverty
COMPARE
Yaqui
Trinidadian and Tobagonian
Male Poverty
Male Poverty Comparison
Yaqui
Trinidadians and Tobagonians
13.7%
MALE POVERTY
0.0/ 100
METRIC RATING
281st/ 347
METRIC RANK
13.1%
MALE POVERTY
0.1/ 100
METRIC RATING
261st/ 347
METRIC RANK
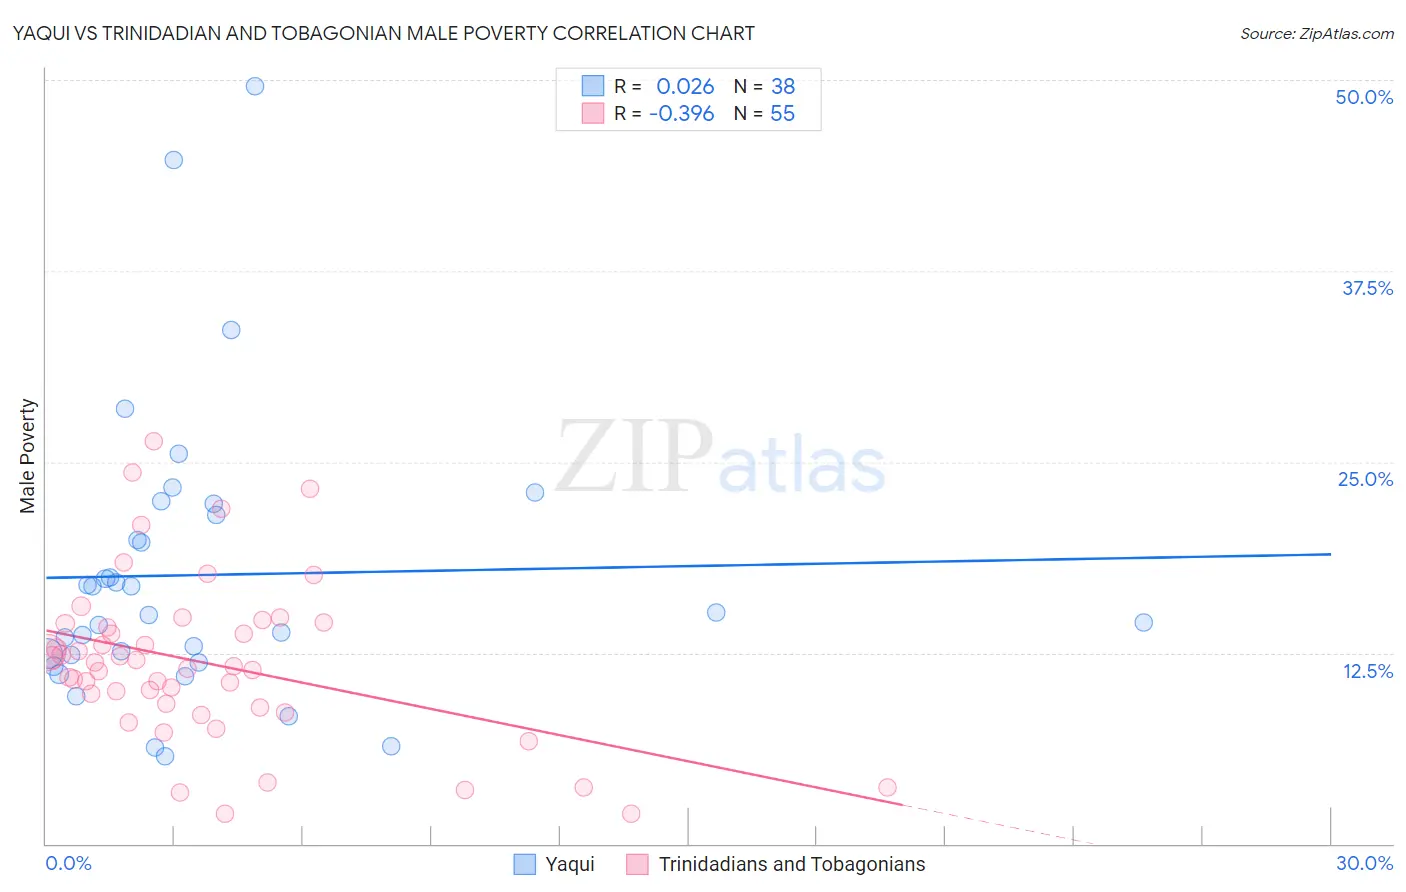
Yaqui vs Trinidadian and Tobagonian Male Poverty Correlation Chart
The statistical analysis conducted on geographies consisting of 107,706,572 people shows no correlation between the proportion of Yaqui and poverty level among males in the United States with a correlation coefficient (R) of 0.026 and weighted average of 13.7%. Similarly, the statistical analysis conducted on geographies consisting of 219,673,525 people shows a mild negative correlation between the proportion of Trinidadians and Tobagonians and poverty level among males in the United States with a correlation coefficient (R) of -0.396 and weighted average of 13.1%, a difference of 4.4%.
Male Poverty Correlation Summary
| Measurement | Yaqui | Trinidadian and Tobagonian |
| Minimum | 5.7% | 2.0% |
| Maximum | 49.6% | 26.4% |
| Range | 43.9% | 24.4% |
| Mean | 17.6% | 11.9% |
| Median | 15.0% | 11.7% |
| Interquartile 25% (IQ1) | 12.4% | 8.9% |
| Interquartile 75% (IQ3) | 21.5% | 14.4% |
| Interquartile Range (IQR) | 9.1% | 5.5% |
| Standard Deviation (Sample) | 9.3% | 5.3% |
| Standard Deviation (Population) | 9.2% | 5.3% |
Demographics Similar to Yaqui and Trinidadians and Tobagonians by Male Poverty
In terms of male poverty, the demographic groups most similar to Yaqui are Mexican (13.7%, a difference of 0.050%), Haitian (13.7%, a difference of 0.14%), Belizean (13.6%, a difference of 0.32%), Bangladeshi (13.6%, a difference of 0.41%), and Immigrants from Latin America (13.6%, a difference of 0.56%). Similarly, the demographic groups most similar to Trinidadians and Tobagonians are Spanish American Indian (13.1%, a difference of 0.050%), Central American (13.2%, a difference of 0.45%), Iroquois (13.2%, a difference of 0.81%), Jamaican (13.2%, a difference of 0.83%), and Immigrants from Guyana (13.2%, a difference of 0.97%).
| Demographics | Rating | Rank | Male Poverty |
| Trinidadians and Tobagonians | 0.1 /100 | #261 | Tragic 13.1% |
| Spanish American Indians | 0.1 /100 | #262 | Tragic 13.1% |
| Central Americans | 0.1 /100 | #263 | Tragic 13.2% |
| Iroquois | 0.1 /100 | #264 | Tragic 13.2% |
| Jamaicans | 0.1 /100 | #265 | Tragic 13.2% |
| Immigrants | Guyana | 0.1 /100 | #266 | Tragic 13.2% |
| Immigrants | Jamaica | 0.1 /100 | #267 | Tragic 13.3% |
| Sub-Saharan Africans | 0.1 /100 | #268 | Tragic 13.3% |
| Guyanese | 0.0 /100 | #269 | Tragic 13.3% |
| Cree | 0.0 /100 | #270 | Tragic 13.3% |
| Spanish Americans | 0.0 /100 | #271 | Tragic 13.4% |
| Immigrants | Bahamas | 0.0 /100 | #272 | Tragic 13.5% |
| Chickasaw | 0.0 /100 | #273 | Tragic 13.5% |
| Immigrants | West Indies | 0.0 /100 | #274 | Tragic 13.5% |
| Barbadians | 0.0 /100 | #275 | Tragic 13.6% |
| Immigrants | Latin America | 0.0 /100 | #276 | Tragic 13.6% |
| Bangladeshis | 0.0 /100 | #277 | Tragic 13.6% |
| Belizeans | 0.0 /100 | #278 | Tragic 13.6% |
| Haitians | 0.0 /100 | #279 | Tragic 13.7% |
| Mexicans | 0.0 /100 | #280 | Tragic 13.7% |
| Yaqui | 0.0 /100 | #281 | Tragic 13.7% |