Yaqui vs Trinidadian and Tobagonian GED/Equivalency
COMPARE
Yaqui
Trinidadian and Tobagonian
GED/Equivalency
GED/Equivalency Comparison
Yaqui
Trinidadians and Tobagonians
80.5%
GED/EQUIVALENCY
0.0/ 100
METRIC RATING
318th/ 347
METRIC RANK
83.0%
GED/EQUIVALENCY
0.2/ 100
METRIC RATING
267th/ 347
METRIC RANK
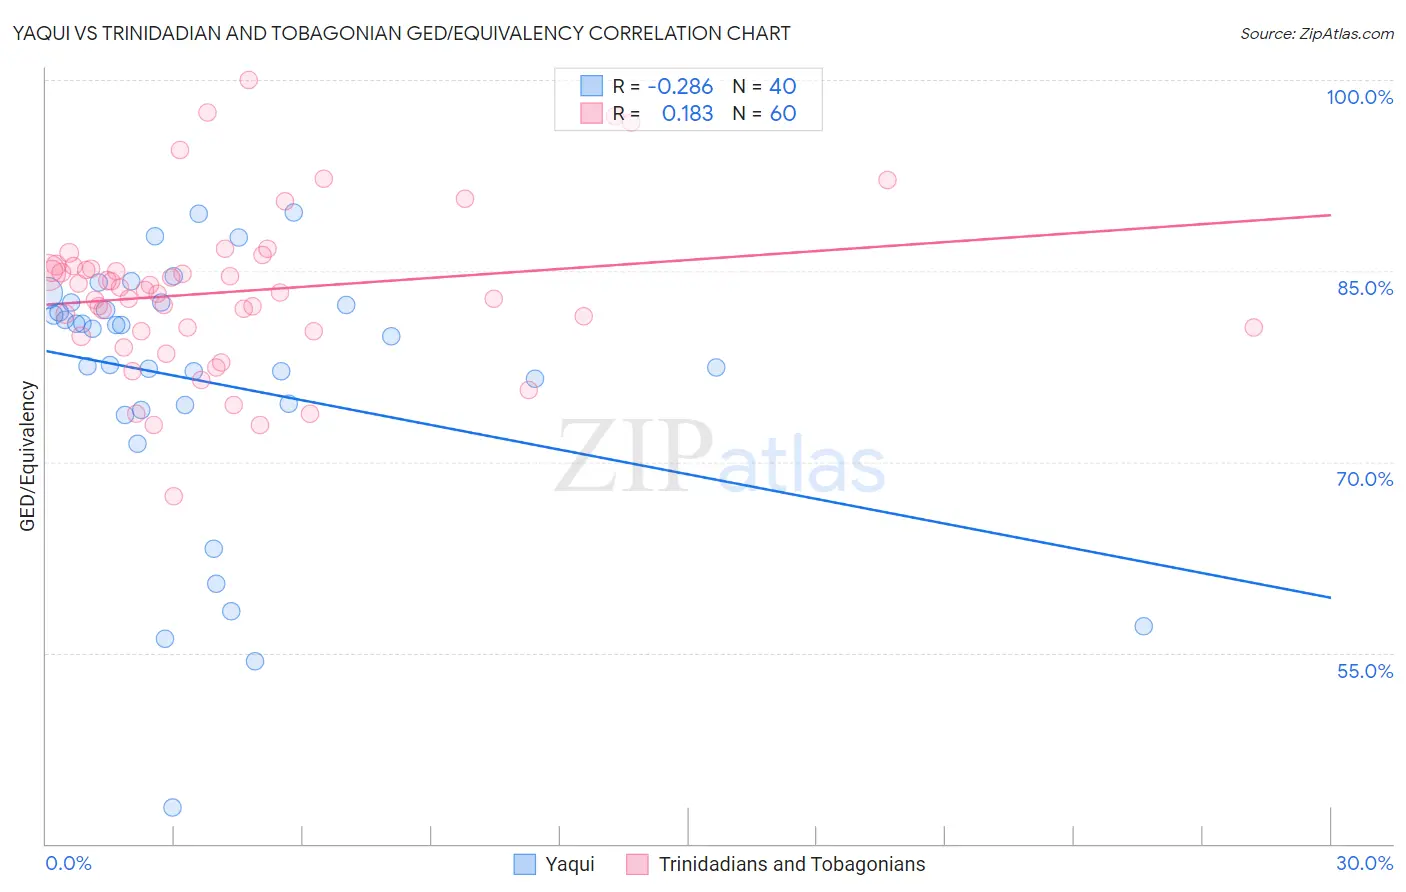
Yaqui vs Trinidadian and Tobagonian GED/Equivalency Correlation Chart
The statistical analysis conducted on geographies consisting of 107,732,380 people shows a weak negative correlation between the proportion of Yaqui and percentage of population with at least ged/equivalency education in the United States with a correlation coefficient (R) of -0.286 and weighted average of 80.5%. Similarly, the statistical analysis conducted on geographies consisting of 219,883,449 people shows a poor positive correlation between the proportion of Trinidadians and Tobagonians and percentage of population with at least ged/equivalency education in the United States with a correlation coefficient (R) of 0.183 and weighted average of 83.0%, a difference of 3.2%.
GED/Equivalency Correlation Summary
| Measurement | Yaqui | Trinidadian and Tobagonian |
| Minimum | 42.9% | 67.3% |
| Maximum | 89.6% | 100.0% |
| Range | 46.7% | 32.7% |
| Mean | 76.2% | 83.4% |
| Median | 80.2% | 83.4% |
| Interquartile 25% (IQ1) | 74.3% | 80.2% |
| Interquartile 75% (IQ3) | 82.4% | 85.3% |
| Interquartile Range (IQR) | 8.1% | 5.0% |
| Standard Deviation (Sample) | 10.6% | 6.3% |
| Standard Deviation (Population) | 10.4% | 6.3% |
Similar Demographics by GED/Equivalency
Demographics Similar to Yaqui by GED/Equivalency
In terms of ged/equivalency, the demographic groups most similar to Yaqui are Immigrants from Belize (80.5%, a difference of 0.0%), Immigrants from Caribbean (80.5%, a difference of 0.020%), Central American Indian (80.6%, a difference of 0.13%), Apache (80.7%, a difference of 0.26%), and Immigrants from Cuba (80.2%, a difference of 0.41%).
| Demographics | Rating | Rank | GED/Equivalency |
| Natives/Alaskans | 0.0 /100 | #311 | Tragic 80.9% |
| Nicaraguans | 0.0 /100 | #312 | Tragic 80.9% |
| Cape Verdeans | 0.0 /100 | #313 | Tragic 80.9% |
| Belizeans | 0.0 /100 | #314 | Tragic 80.9% |
| Apache | 0.0 /100 | #315 | Tragic 80.7% |
| Central American Indians | 0.0 /100 | #316 | Tragic 80.6% |
| Immigrants | Caribbean | 0.0 /100 | #317 | Tragic 80.5% |
| Yaqui | 0.0 /100 | #318 | Tragic 80.5% |
| Immigrants | Belize | 0.0 /100 | #319 | Tragic 80.5% |
| Immigrants | Cuba | 0.0 /100 | #320 | Tragic 80.2% |
| Yup'ik | 0.0 /100 | #321 | Tragic 80.0% |
| Lumbee | 0.0 /100 | #322 | Tragic 80.0% |
| Immigrants | Nicaragua | 0.0 /100 | #323 | Tragic 79.9% |
| Mexican American Indians | 0.0 /100 | #324 | Tragic 79.4% |
| Hondurans | 0.0 /100 | #325 | Tragic 79.3% |
Demographics Similar to Trinidadians and Tobagonians by GED/Equivalency
In terms of ged/equivalency, the demographic groups most similar to Trinidadians and Tobagonians are West Indian (83.1%, a difference of 0.020%), Kiowa (83.1%, a difference of 0.020%), Bangladeshi (83.1%, a difference of 0.030%), Immigrants from Congo (83.1%, a difference of 0.040%), and Immigrants from Burma/Myanmar (83.0%, a difference of 0.040%).
| Demographics | Rating | Rank | GED/Equivalency |
| Choctaw | 0.3 /100 | #260 | Tragic 83.1% |
| Inupiat | 0.2 /100 | #261 | Tragic 83.1% |
| Immigrants | Armenia | 0.2 /100 | #262 | Tragic 83.1% |
| Immigrants | Congo | 0.2 /100 | #263 | Tragic 83.1% |
| Bangladeshis | 0.2 /100 | #264 | Tragic 83.1% |
| West Indians | 0.2 /100 | #265 | Tragic 83.1% |
| Kiowa | 0.2 /100 | #266 | Tragic 83.1% |
| Trinidadians and Tobagonians | 0.2 /100 | #267 | Tragic 83.0% |
| Immigrants | Burma/Myanmar | 0.2 /100 | #268 | Tragic 83.0% |
| Hopi | 0.2 /100 | #269 | Tragic 83.0% |
| Immigrants | Jamaica | 0.2 /100 | #270 | Tragic 82.9% |
| U.S. Virgin Islanders | 0.2 /100 | #271 | Tragic 82.9% |
| Barbadians | 0.1 /100 | #272 | Tragic 82.9% |
| Pennsylvania Germans | 0.1 /100 | #273 | Tragic 82.9% |
| Immigrants | Trinidad and Tobago | 0.1 /100 | #274 | Tragic 82.8% |