Nepalese vs Trinidadian and Tobagonian Male Poverty
COMPARE
Nepalese
Trinidadian and Tobagonian
Male Poverty
Male Poverty Comparison
Nepalese
Trinidadians and Tobagonians
12.8%
MALE POVERTY
0.3/ 100
METRIC RATING
242nd/ 347
METRIC RANK
13.1%
MALE POVERTY
0.1/ 100
METRIC RATING
261st/ 347
METRIC RANK
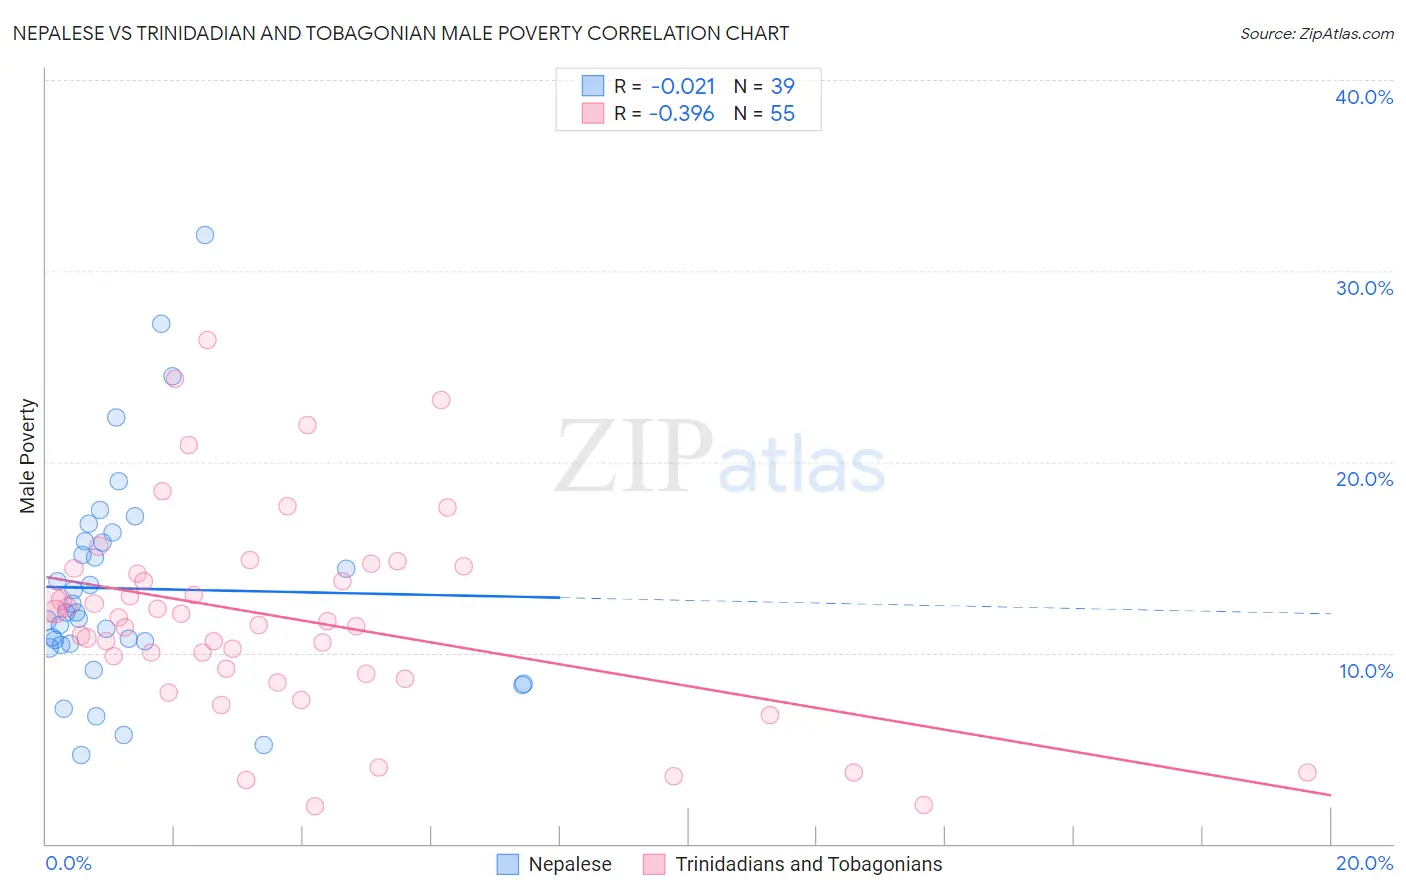
Nepalese vs Trinidadian and Tobagonian Male Poverty Correlation Chart
The statistical analysis conducted on geographies consisting of 24,519,269 people shows no correlation between the proportion of Nepalese and poverty level among males in the United States with a correlation coefficient (R) of -0.021 and weighted average of 12.8%. Similarly, the statistical analysis conducted on geographies consisting of 219,673,525 people shows a mild negative correlation between the proportion of Trinidadians and Tobagonians and poverty level among males in the United States with a correlation coefficient (R) of -0.396 and weighted average of 13.1%, a difference of 2.5%.
Male Poverty Correlation Summary
| Measurement | Nepalese | Trinidadian and Tobagonian |
| Minimum | 4.7% | 2.0% |
| Maximum | 31.9% | 26.4% |
| Range | 27.2% | 24.4% |
| Mean | 13.4% | 11.9% |
| Median | 12.1% | 11.7% |
| Interquartile 25% (IQ1) | 10.4% | 8.9% |
| Interquartile 75% (IQ3) | 15.8% | 14.4% |
| Interquartile Range (IQR) | 5.4% | 5.5% |
| Standard Deviation (Sample) | 5.8% | 5.3% |
| Standard Deviation (Population) | 5.7% | 5.3% |
Demographics Similar to Nepalese and Trinidadians and Tobagonians by Male Poverty
In terms of male poverty, the demographic groups most similar to Nepalese are Alaskan Athabascan (12.8%, a difference of 0.040%), Tsimshian (12.8%, a difference of 0.14%), Liberian (12.8%, a difference of 0.16%), Sudanese (12.8%, a difference of 0.17%), and Immigrants from El Salvador (12.8%, a difference of 0.46%). Similarly, the demographic groups most similar to Trinidadians and Tobagonians are Ottawa (13.1%, a difference of 0.020%), Cherokee (13.1%, a difference of 0.13%), Cape Verdean (13.1%, a difference of 0.30%), Immigrants from Trinidad and Tobago (13.1%, a difference of 0.42%), and Immigrants from Burma/Myanmar (13.0%, a difference of 0.69%).
| Demographics | Rating | Rank | Male Poverty |
| Sudanese | 0.3 /100 | #241 | Tragic 12.8% |
| Nepalese | 0.3 /100 | #242 | Tragic 12.8% |
| Alaskan Athabascans | 0.3 /100 | #243 | Tragic 12.8% |
| Tsimshian | 0.3 /100 | #244 | Tragic 12.8% |
| Liberians | 0.3 /100 | #245 | Tragic 12.8% |
| Immigrants | El Salvador | 0.2 /100 | #246 | Tragic 12.8% |
| Immigrants | Western Africa | 0.2 /100 | #247 | Tragic 12.9% |
| Immigrants | Sudan | 0.2 /100 | #248 | Tragic 12.9% |
| Potawatomi | 0.2 /100 | #249 | Tragic 12.9% |
| Immigrants | Nicaragua | 0.2 /100 | #250 | Tragic 12.9% |
| Immigrants | Cuba | 0.2 /100 | #251 | Tragic 12.9% |
| Immigrants | Ecuador | 0.2 /100 | #252 | Tragic 12.9% |
| Immigrants | Ghana | 0.2 /100 | #253 | Tragic 12.9% |
| Mexican American Indians | 0.1 /100 | #254 | Tragic 13.0% |
| Immigrants | Liberia | 0.1 /100 | #255 | Tragic 13.0% |
| Immigrants | Burma/Myanmar | 0.1 /100 | #256 | Tragic 13.0% |
| Immigrants | Trinidad and Tobago | 0.1 /100 | #257 | Tragic 13.1% |
| Cape Verdeans | 0.1 /100 | #258 | Tragic 13.1% |
| Cherokee | 0.1 /100 | #259 | Tragic 13.1% |
| Ottawa | 0.1 /100 | #260 | Tragic 13.1% |
| Trinidadians and Tobagonians | 0.1 /100 | #261 | Tragic 13.1% |