Yaqui vs Dominican Male Poverty
COMPARE
Yaqui
Dominican
Male Poverty
Male Poverty Comparison
Yaqui
Dominicans
13.7%
MALE POVERTY
0.0/ 100
METRIC RATING
281st/ 347
METRIC RANK
16.1%
MALE POVERTY
0.0/ 100
METRIC RATING
329th/ 347
METRIC RANK
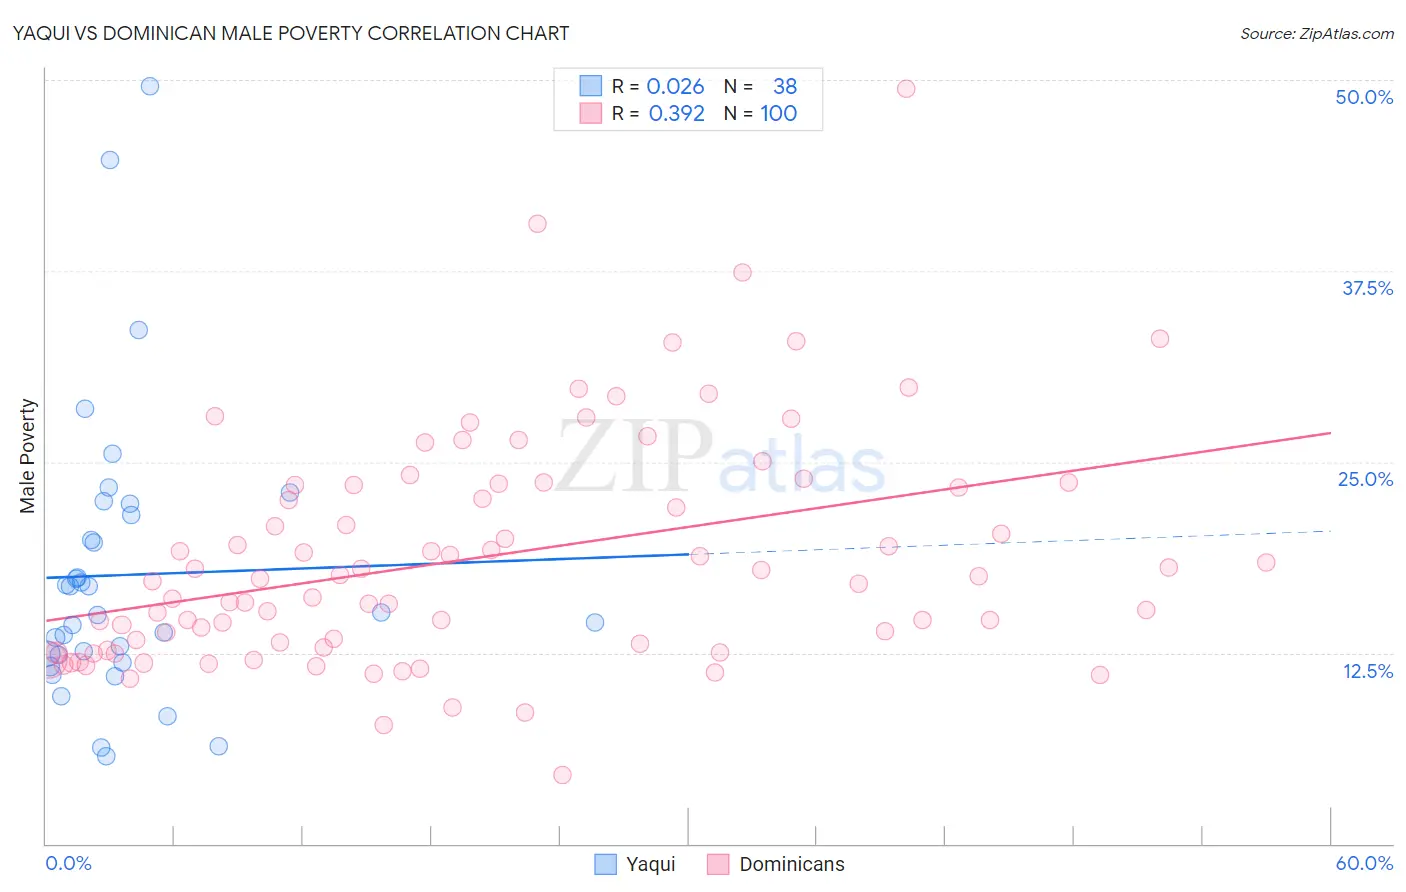
Yaqui vs Dominican Male Poverty Correlation Chart
The statistical analysis conducted on geographies consisting of 107,706,572 people shows no correlation between the proportion of Yaqui and poverty level among males in the United States with a correlation coefficient (R) of 0.026 and weighted average of 13.7%. Similarly, the statistical analysis conducted on geographies consisting of 354,651,464 people shows a mild positive correlation between the proportion of Dominicans and poverty level among males in the United States with a correlation coefficient (R) of 0.392 and weighted average of 16.1%, a difference of 17.5%.
Male Poverty Correlation Summary
| Measurement | Yaqui | Dominican |
| Minimum | 5.7% | 4.5% |
| Maximum | 49.6% | 49.4% |
| Range | 43.9% | 44.9% |
| Mean | 17.6% | 18.7% |
| Median | 15.0% | 17.2% |
| Interquartile 25% (IQ1) | 12.4% | 13.0% |
| Interquartile 75% (IQ3) | 21.5% | 23.5% |
| Interquartile Range (IQR) | 9.1% | 10.5% |
| Standard Deviation (Sample) | 9.3% | 7.5% |
| Standard Deviation (Population) | 9.2% | 7.5% |
Similar Demographics by Male Poverty
Demographics Similar to Yaqui by Male Poverty
In terms of male poverty, the demographic groups most similar to Yaqui are Mexican (13.7%, a difference of 0.050%), Haitian (13.7%, a difference of 0.14%), Immigrants from Cabo Verde (13.7%, a difference of 0.27%), Belizean (13.6%, a difference of 0.32%), and Bangladeshi (13.6%, a difference of 0.41%).
| Demographics | Rating | Rank | Male Poverty |
| Immigrants | West Indies | 0.0 /100 | #274 | Tragic 13.5% |
| Barbadians | 0.0 /100 | #275 | Tragic 13.6% |
| Immigrants | Latin America | 0.0 /100 | #276 | Tragic 13.6% |
| Bangladeshis | 0.0 /100 | #277 | Tragic 13.6% |
| Belizeans | 0.0 /100 | #278 | Tragic 13.6% |
| Haitians | 0.0 /100 | #279 | Tragic 13.7% |
| Mexicans | 0.0 /100 | #280 | Tragic 13.7% |
| Yaqui | 0.0 /100 | #281 | Tragic 13.7% |
| Immigrants | Cabo Verde | 0.0 /100 | #282 | Tragic 13.7% |
| Comanche | 0.0 /100 | #283 | Tragic 13.8% |
| Immigrants | Haiti | 0.0 /100 | #284 | Tragic 13.8% |
| West Indians | 0.0 /100 | #285 | Tragic 13.8% |
| Shoshone | 0.0 /100 | #286 | Tragic 13.8% |
| Immigrants | Barbados | 0.0 /100 | #287 | Tragic 13.8% |
| Immigrants | St. Vincent and the Grenadines | 0.0 /100 | #288 | Tragic 13.8% |
Demographics Similar to Dominicans by Male Poverty
In terms of male poverty, the demographic groups most similar to Dominicans are Immigrants from Dominican Republic (16.2%, a difference of 0.65%), Ute (16.2%, a difference of 0.99%), Black/African American (15.8%, a difference of 1.7%), Paiute (15.8%, a difference of 1.8%), and Houma (16.7%, a difference of 4.0%).
| Demographics | Rating | Rank | Male Poverty |
| Kiowa | 0.0 /100 | #322 | Tragic 15.2% |
| Colville | 0.0 /100 | #323 | Tragic 15.2% |
| Menominee | 0.0 /100 | #324 | Tragic 15.3% |
| Yakama | 0.0 /100 | #325 | Tragic 15.3% |
| Central American Indians | 0.0 /100 | #326 | Tragic 15.3% |
| Paiute | 0.0 /100 | #327 | Tragic 15.8% |
| Blacks/African Americans | 0.0 /100 | #328 | Tragic 15.8% |
| Dominicans | 0.0 /100 | #329 | Tragic 16.1% |
| Immigrants | Dominican Republic | 0.0 /100 | #330 | Tragic 16.2% |
| Ute | 0.0 /100 | #331 | Tragic 16.2% |
| Houma | 0.0 /100 | #332 | Tragic 16.7% |
| Natives/Alaskans | 0.0 /100 | #333 | Tragic 16.9% |
| Cheyenne | 0.0 /100 | #334 | Tragic 17.6% |
| Apache | 0.0 /100 | #335 | Tragic 17.7% |
| Pueblo | 0.0 /100 | #336 | Tragic 18.5% |