Yaqui vs Immigrants from South Central Asia Male Poverty
COMPARE
Yaqui
Immigrants from South Central Asia
Male Poverty
Male Poverty Comparison
Yaqui
Immigrants from South Central Asia
13.7%
MALE POVERTY
0.0/ 100
METRIC RATING
281st/ 347
METRIC RANK
9.3%
MALE POVERTY
99.9/ 100
METRIC RATING
9th/ 347
METRIC RANK
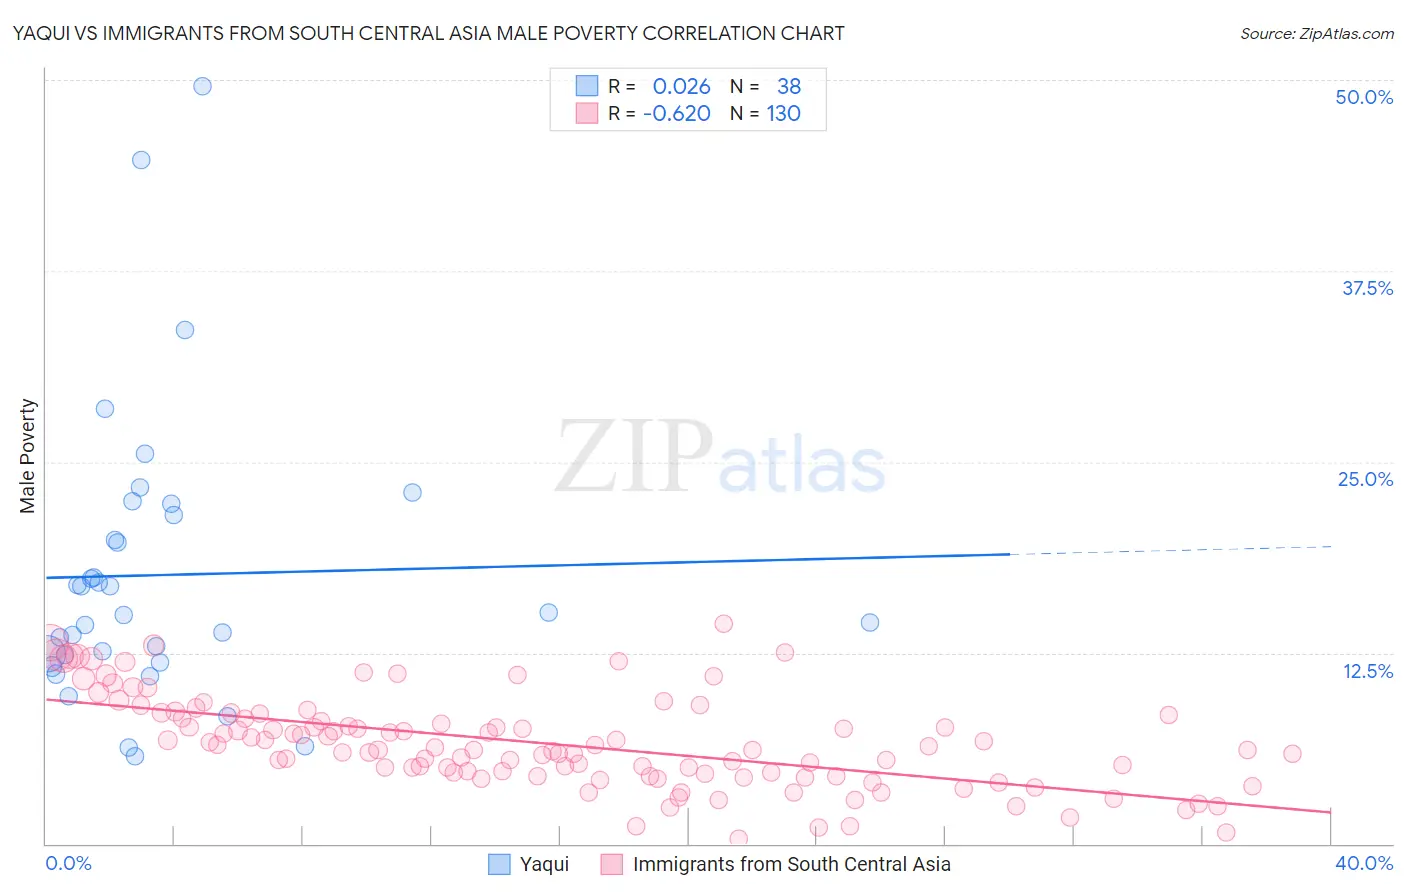
Yaqui vs Immigrants from South Central Asia Male Poverty Correlation Chart
The statistical analysis conducted on geographies consisting of 107,706,572 people shows no correlation between the proportion of Yaqui and poverty level among males in the United States with a correlation coefficient (R) of 0.026 and weighted average of 13.7%. Similarly, the statistical analysis conducted on geographies consisting of 472,354,703 people shows a significant negative correlation between the proportion of Immigrants from South Central Asia and poverty level among males in the United States with a correlation coefficient (R) of -0.620 and weighted average of 9.3%, a difference of 47.6%.
Male Poverty Correlation Summary
| Measurement | Yaqui | Immigrants from South Central Asia |
| Minimum | 5.7% | 0.33% |
| Maximum | 49.6% | 14.4% |
| Range | 43.9% | 14.0% |
| Mean | 17.6% | 6.6% |
| Median | 15.0% | 6.2% |
| Interquartile 25% (IQ1) | 12.4% | 4.6% |
| Interquartile 75% (IQ3) | 21.5% | 8.4% |
| Interquartile Range (IQR) | 9.1% | 3.8% |
| Standard Deviation (Sample) | 9.3% | 3.0% |
| Standard Deviation (Population) | 9.2% | 3.0% |
Similar Demographics by Male Poverty
Demographics Similar to Yaqui by Male Poverty
In terms of male poverty, the demographic groups most similar to Yaqui are Mexican (13.7%, a difference of 0.050%), Haitian (13.7%, a difference of 0.14%), Immigrants from Cabo Verde (13.7%, a difference of 0.27%), Belizean (13.6%, a difference of 0.32%), and Bangladeshi (13.6%, a difference of 0.41%).
| Demographics | Rating | Rank | Male Poverty |
| Immigrants | West Indies | 0.0 /100 | #274 | Tragic 13.5% |
| Barbadians | 0.0 /100 | #275 | Tragic 13.6% |
| Immigrants | Latin America | 0.0 /100 | #276 | Tragic 13.6% |
| Bangladeshis | 0.0 /100 | #277 | Tragic 13.6% |
| Belizeans | 0.0 /100 | #278 | Tragic 13.6% |
| Haitians | 0.0 /100 | #279 | Tragic 13.7% |
| Mexicans | 0.0 /100 | #280 | Tragic 13.7% |
| Yaqui | 0.0 /100 | #281 | Tragic 13.7% |
| Immigrants | Cabo Verde | 0.0 /100 | #282 | Tragic 13.7% |
| Comanche | 0.0 /100 | #283 | Tragic 13.8% |
| Immigrants | Haiti | 0.0 /100 | #284 | Tragic 13.8% |
| West Indians | 0.0 /100 | #285 | Tragic 13.8% |
| Shoshone | 0.0 /100 | #286 | Tragic 13.8% |
| Immigrants | Barbados | 0.0 /100 | #287 | Tragic 13.8% |
| Immigrants | St. Vincent and the Grenadines | 0.0 /100 | #288 | Tragic 13.8% |
Demographics Similar to Immigrants from South Central Asia by Male Poverty
In terms of male poverty, the demographic groups most similar to Immigrants from South Central Asia are Bulgarian (9.3%, a difference of 0.56%), Filipino (9.2%, a difference of 0.79%), Bolivian (9.4%, a difference of 1.2%), Immigrants from Bolivia (9.4%, a difference of 1.3%), and Immigrants from Lithuania (9.4%, a difference of 1.4%).
| Demographics | Rating | Rank | Male Poverty |
| Chinese | 100.0 /100 | #2 | Exceptional 8.7% |
| Thais | 100.0 /100 | #3 | Exceptional 8.7% |
| Immigrants | Taiwan | 100.0 /100 | #4 | Exceptional 8.9% |
| Maltese | 100.0 /100 | #5 | Exceptional 9.1% |
| Assyrians/Chaldeans/Syriacs | 99.9 /100 | #6 | Exceptional 9.1% |
| Immigrants | Ireland | 99.9 /100 | #7 | Exceptional 9.1% |
| Filipinos | 99.9 /100 | #8 | Exceptional 9.2% |
| Immigrants | South Central Asia | 99.9 /100 | #9 | Exceptional 9.3% |
| Bulgarians | 99.9 /100 | #10 | Exceptional 9.3% |
| Bolivians | 99.9 /100 | #11 | Exceptional 9.4% |
| Immigrants | Bolivia | 99.9 /100 | #12 | Exceptional 9.4% |
| Immigrants | Lithuania | 99.9 /100 | #13 | Exceptional 9.4% |
| Immigrants | North Macedonia | 99.8 /100 | #14 | Exceptional 9.4% |
| Bhutanese | 99.8 /100 | #15 | Exceptional 9.5% |
| Luxembourgers | 99.8 /100 | #16 | Exceptional 9.5% |