Israeli vs Trinidadian and Tobagonian Male Poverty
COMPARE
Israeli
Trinidadian and Tobagonian
Male Poverty
Male Poverty Comparison
Israelis
Trinidadians and Tobagonians
11.5%
MALE POVERTY
26.1/ 100
METRIC RATING
190th/ 347
METRIC RANK
13.1%
MALE POVERTY
0.1/ 100
METRIC RATING
261st/ 347
METRIC RANK
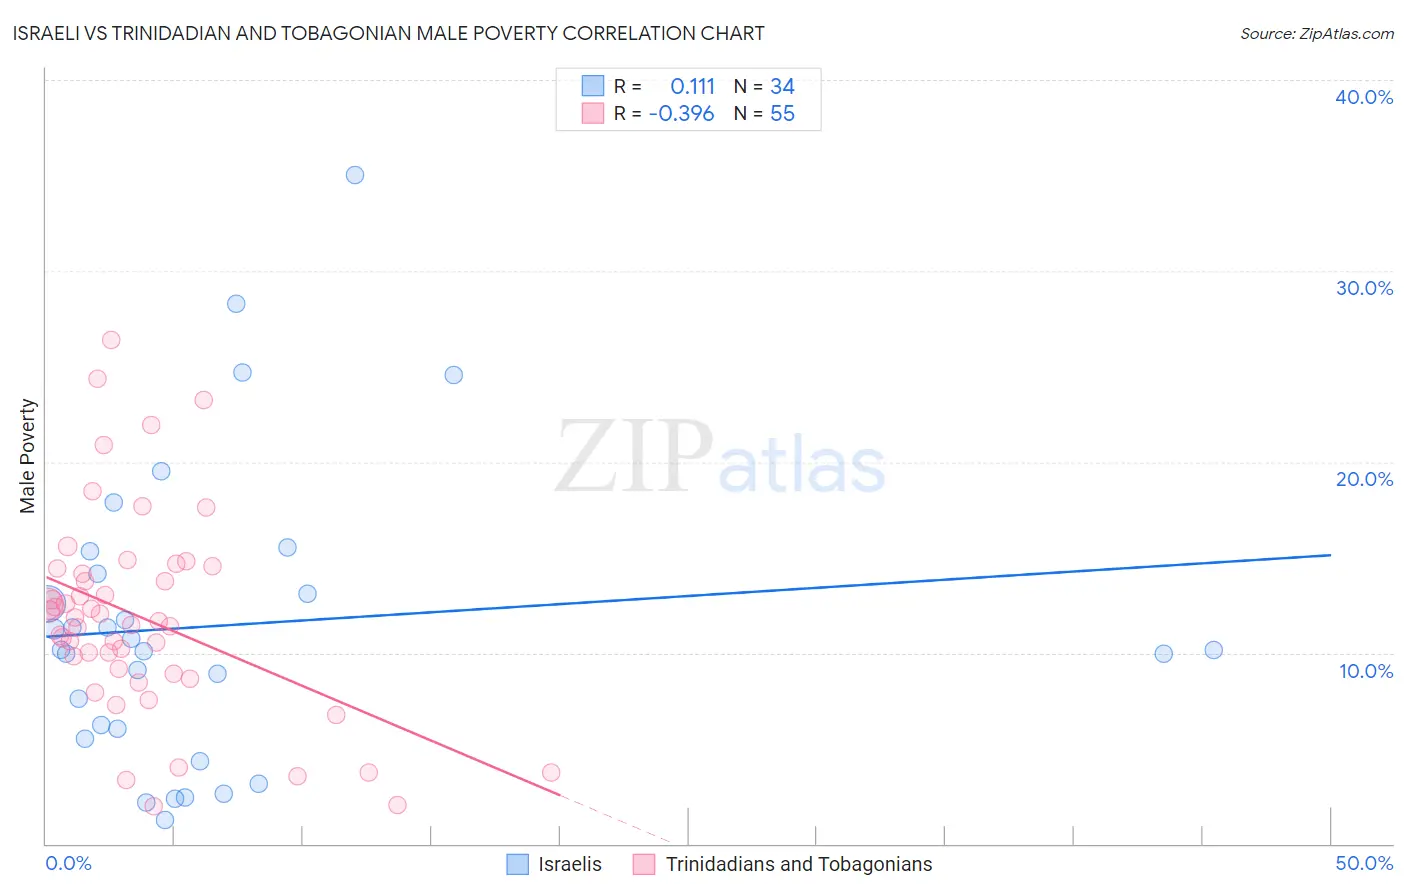
Israeli vs Trinidadian and Tobagonian Male Poverty Correlation Chart
The statistical analysis conducted on geographies consisting of 210,981,593 people shows a poor positive correlation between the proportion of Israelis and poverty level among males in the United States with a correlation coefficient (R) of 0.111 and weighted average of 11.5%. Similarly, the statistical analysis conducted on geographies consisting of 219,673,525 people shows a mild negative correlation between the proportion of Trinidadians and Tobagonians and poverty level among males in the United States with a correlation coefficient (R) of -0.396 and weighted average of 13.1%, a difference of 14.2%.
Male Poverty Correlation Summary
| Measurement | Israeli | Trinidadian and Tobagonian |
| Minimum | 1.2% | 2.0% |
| Maximum | 35.0% | 26.4% |
| Range | 33.8% | 24.4% |
| Mean | 11.4% | 11.9% |
| Median | 10.2% | 11.7% |
| Interquartile 25% (IQ1) | 6.0% | 8.9% |
| Interquartile 75% (IQ3) | 14.1% | 14.4% |
| Interquartile Range (IQR) | 8.1% | 5.5% |
| Standard Deviation (Sample) | 7.8% | 5.3% |
| Standard Deviation (Population) | 7.7% | 5.3% |
Similar Demographics by Male Poverty
Demographics Similar to Israelis by Male Poverty
In terms of male poverty, the demographic groups most similar to Israelis are Hawaiian (11.4%, a difference of 0.26%), South American Indian (11.5%, a difference of 0.43%), Sierra Leonean (11.4%, a difference of 0.45%), Immigrants from Iraq (11.4%, a difference of 0.67%), and Immigrants from Sierra Leone (11.4%, a difference of 0.79%).
| Demographics | Rating | Rank | Male Poverty |
| Kenyans | 38.4 /100 | #183 | Fair 11.3% |
| Immigrants | South America | 36.9 /100 | #184 | Fair 11.3% |
| Immigrants | Afghanistan | 33.3 /100 | #185 | Fair 11.4% |
| Immigrants | Sierra Leone | 32.9 /100 | #186 | Fair 11.4% |
| Immigrants | Iraq | 31.9 /100 | #187 | Fair 11.4% |
| Sierra Leoneans | 29.9 /100 | #188 | Fair 11.4% |
| Hawaiians | 28.3 /100 | #189 | Fair 11.4% |
| Israelis | 26.1 /100 | #190 | Fair 11.5% |
| South American Indians | 22.8 /100 | #191 | Fair 11.5% |
| Immigrants | Uruguay | 19.1 /100 | #192 | Poor 11.6% |
| Immigrants | Kuwait | 17.3 /100 | #193 | Poor 11.6% |
| Immigrants | Kenya | 16.1 /100 | #194 | Poor 11.6% |
| Arabs | 15.8 /100 | #195 | Poor 11.6% |
| Hmong | 15.8 /100 | #196 | Poor 11.6% |
| Delaware | 15.4 /100 | #197 | Poor 11.7% |
Demographics Similar to Trinidadians and Tobagonians by Male Poverty
In terms of male poverty, the demographic groups most similar to Trinidadians and Tobagonians are Ottawa (13.1%, a difference of 0.020%), Spanish American Indian (13.1%, a difference of 0.050%), Cherokee (13.1%, a difference of 0.13%), Cape Verdean (13.1%, a difference of 0.30%), and Immigrants from Trinidad and Tobago (13.1%, a difference of 0.42%).
| Demographics | Rating | Rank | Male Poverty |
| Mexican American Indians | 0.1 /100 | #254 | Tragic 13.0% |
| Immigrants | Liberia | 0.1 /100 | #255 | Tragic 13.0% |
| Immigrants | Burma/Myanmar | 0.1 /100 | #256 | Tragic 13.0% |
| Immigrants | Trinidad and Tobago | 0.1 /100 | #257 | Tragic 13.1% |
| Cape Verdeans | 0.1 /100 | #258 | Tragic 13.1% |
| Cherokee | 0.1 /100 | #259 | Tragic 13.1% |
| Ottawa | 0.1 /100 | #260 | Tragic 13.1% |
| Trinidadians and Tobagonians | 0.1 /100 | #261 | Tragic 13.1% |
| Spanish American Indians | 0.1 /100 | #262 | Tragic 13.1% |
| Central Americans | 0.1 /100 | #263 | Tragic 13.2% |
| Iroquois | 0.1 /100 | #264 | Tragic 13.2% |
| Jamaicans | 0.1 /100 | #265 | Tragic 13.2% |
| Immigrants | Guyana | 0.1 /100 | #266 | Tragic 13.2% |
| Immigrants | Jamaica | 0.1 /100 | #267 | Tragic 13.3% |
| Sub-Saharan Africans | 0.1 /100 | #268 | Tragic 13.3% |