Immigrants from Taiwan vs Trinidadian and Tobagonian Male Poverty
COMPARE
Immigrants from Taiwan
Trinidadian and Tobagonian
Male Poverty
Male Poverty Comparison
Immigrants from Taiwan
Trinidadians and Tobagonians
8.9%
MALE POVERTY
100.0/ 100
METRIC RATING
4th/ 347
METRIC RANK
13.1%
MALE POVERTY
0.1/ 100
METRIC RATING
261st/ 347
METRIC RANK
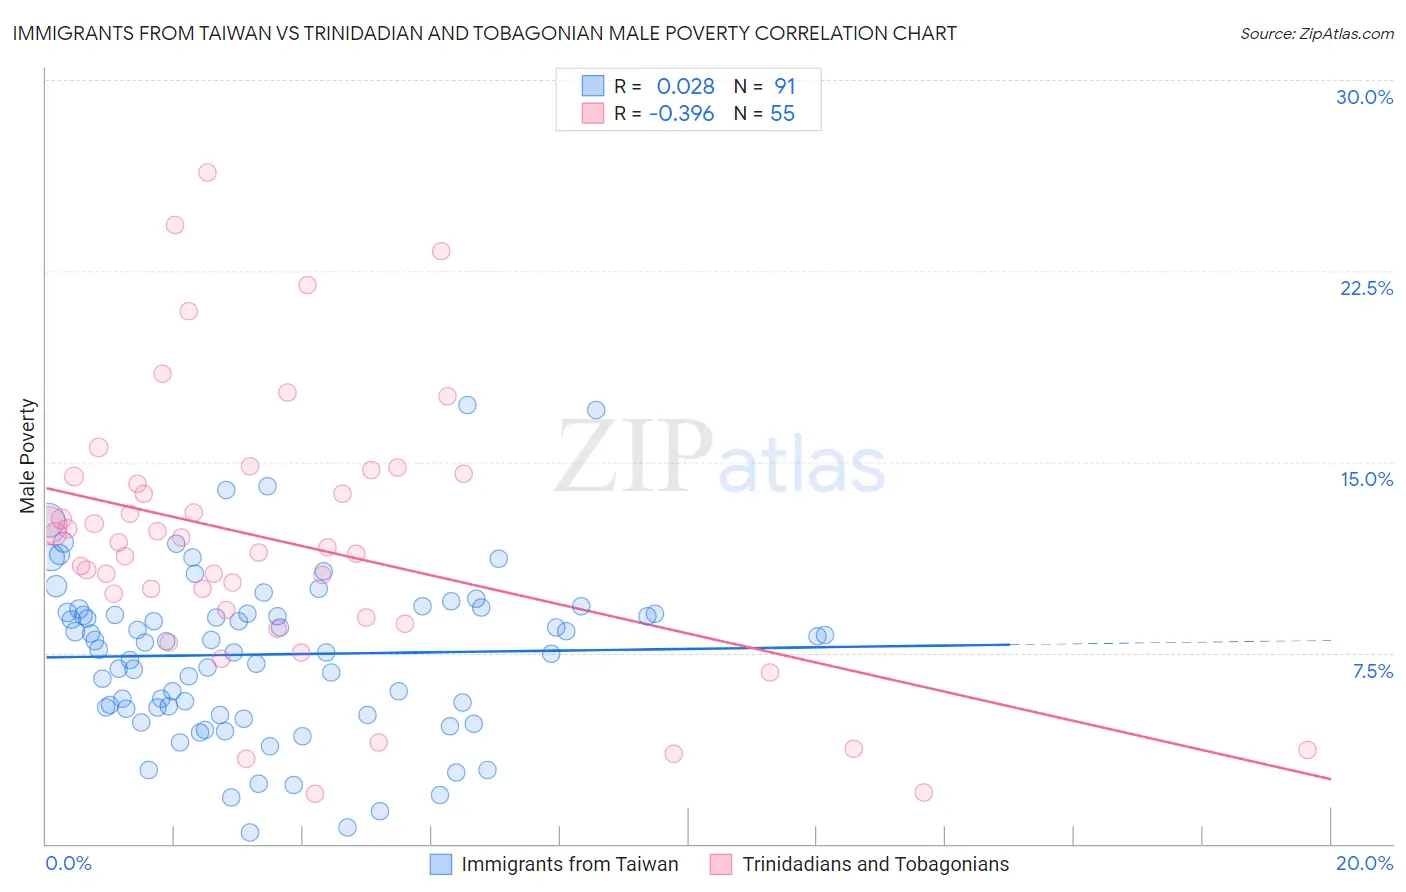
Immigrants from Taiwan vs Trinidadian and Tobagonian Male Poverty Correlation Chart
The statistical analysis conducted on geographies consisting of 298,036,571 people shows no correlation between the proportion of Immigrants from Taiwan and poverty level among males in the United States with a correlation coefficient (R) of 0.028 and weighted average of 8.9%. Similarly, the statistical analysis conducted on geographies consisting of 219,673,525 people shows a mild negative correlation between the proportion of Trinidadians and Tobagonians and poverty level among males in the United States with a correlation coefficient (R) of -0.396 and weighted average of 13.1%, a difference of 47.3%.
Male Poverty Correlation Summary
| Measurement | Immigrants from Taiwan | Trinidadian and Tobagonian |
| Minimum | 0.43% | 2.0% |
| Maximum | 17.2% | 26.4% |
| Range | 16.8% | 24.4% |
| Mean | 7.4% | 11.9% |
| Median | 7.9% | 11.7% |
| Interquartile 25% (IQ1) | 5.3% | 8.9% |
| Interquartile 75% (IQ3) | 9.1% | 14.4% |
| Interquartile Range (IQR) | 3.8% | 5.5% |
| Standard Deviation (Sample) | 3.2% | 5.3% |
| Standard Deviation (Population) | 3.2% | 5.3% |
Similar Demographics by Male Poverty
Demographics Similar to Immigrants from Taiwan by Male Poverty
In terms of male poverty, the demographic groups most similar to Immigrants from Taiwan are Maltese (9.1%, a difference of 2.0%), Thai (8.7%, a difference of 2.3%), Chinese (8.7%, a difference of 2.4%), Assyrian/Chaldean/Syriac (9.1%, a difference of 2.7%), and Immigrants from Ireland (9.1%, a difference of 2.7%).
| Demographics | Rating | Rank | Male Poverty |
| Immigrants | India | 100.0 /100 | #1 | Exceptional 8.2% |
| Chinese | 100.0 /100 | #2 | Exceptional 8.7% |
| Thais | 100.0 /100 | #3 | Exceptional 8.7% |
| Immigrants | Taiwan | 100.0 /100 | #4 | Exceptional 8.9% |
| Maltese | 100.0 /100 | #5 | Exceptional 9.1% |
| Assyrians/Chaldeans/Syriacs | 99.9 /100 | #6 | Exceptional 9.1% |
| Immigrants | Ireland | 99.9 /100 | #7 | Exceptional 9.1% |
| Filipinos | 99.9 /100 | #8 | Exceptional 9.2% |
| Immigrants | South Central Asia | 99.9 /100 | #9 | Exceptional 9.3% |
| Bulgarians | 99.9 /100 | #10 | Exceptional 9.3% |
| Bolivians | 99.9 /100 | #11 | Exceptional 9.4% |
| Immigrants | Bolivia | 99.9 /100 | #12 | Exceptional 9.4% |
| Immigrants | Lithuania | 99.9 /100 | #13 | Exceptional 9.4% |
| Immigrants | North Macedonia | 99.8 /100 | #14 | Exceptional 9.4% |
| Bhutanese | 99.8 /100 | #15 | Exceptional 9.5% |
Demographics Similar to Trinidadians and Tobagonians by Male Poverty
In terms of male poverty, the demographic groups most similar to Trinidadians and Tobagonians are Ottawa (13.1%, a difference of 0.020%), Spanish American Indian (13.1%, a difference of 0.050%), Cherokee (13.1%, a difference of 0.13%), Cape Verdean (13.1%, a difference of 0.30%), and Immigrants from Trinidad and Tobago (13.1%, a difference of 0.42%).
| Demographics | Rating | Rank | Male Poverty |
| Mexican American Indians | 0.1 /100 | #254 | Tragic 13.0% |
| Immigrants | Liberia | 0.1 /100 | #255 | Tragic 13.0% |
| Immigrants | Burma/Myanmar | 0.1 /100 | #256 | Tragic 13.0% |
| Immigrants | Trinidad and Tobago | 0.1 /100 | #257 | Tragic 13.1% |
| Cape Verdeans | 0.1 /100 | #258 | Tragic 13.1% |
| Cherokee | 0.1 /100 | #259 | Tragic 13.1% |
| Ottawa | 0.1 /100 | #260 | Tragic 13.1% |
| Trinidadians and Tobagonians | 0.1 /100 | #261 | Tragic 13.1% |
| Spanish American Indians | 0.1 /100 | #262 | Tragic 13.1% |
| Central Americans | 0.1 /100 | #263 | Tragic 13.2% |
| Iroquois | 0.1 /100 | #264 | Tragic 13.2% |
| Jamaicans | 0.1 /100 | #265 | Tragic 13.2% |
| Immigrants | Guyana | 0.1 /100 | #266 | Tragic 13.2% |
| Immigrants | Jamaica | 0.1 /100 | #267 | Tragic 13.3% |
| Sub-Saharan Africans | 0.1 /100 | #268 | Tragic 13.3% |