Welsh vs Navajo Single Male Poverty
COMPARE
Welsh
Navajo
Single Male Poverty
Single Male Poverty Comparison
Welsh
Navajo
14.0%
SINGLE MALE POVERTY
0.1/ 100
METRIC RATING
273rd/ 347
METRIC RANK
25.3%
SINGLE MALE POVERTY
0.0/ 100
METRIC RATING
345th/ 347
METRIC RANK
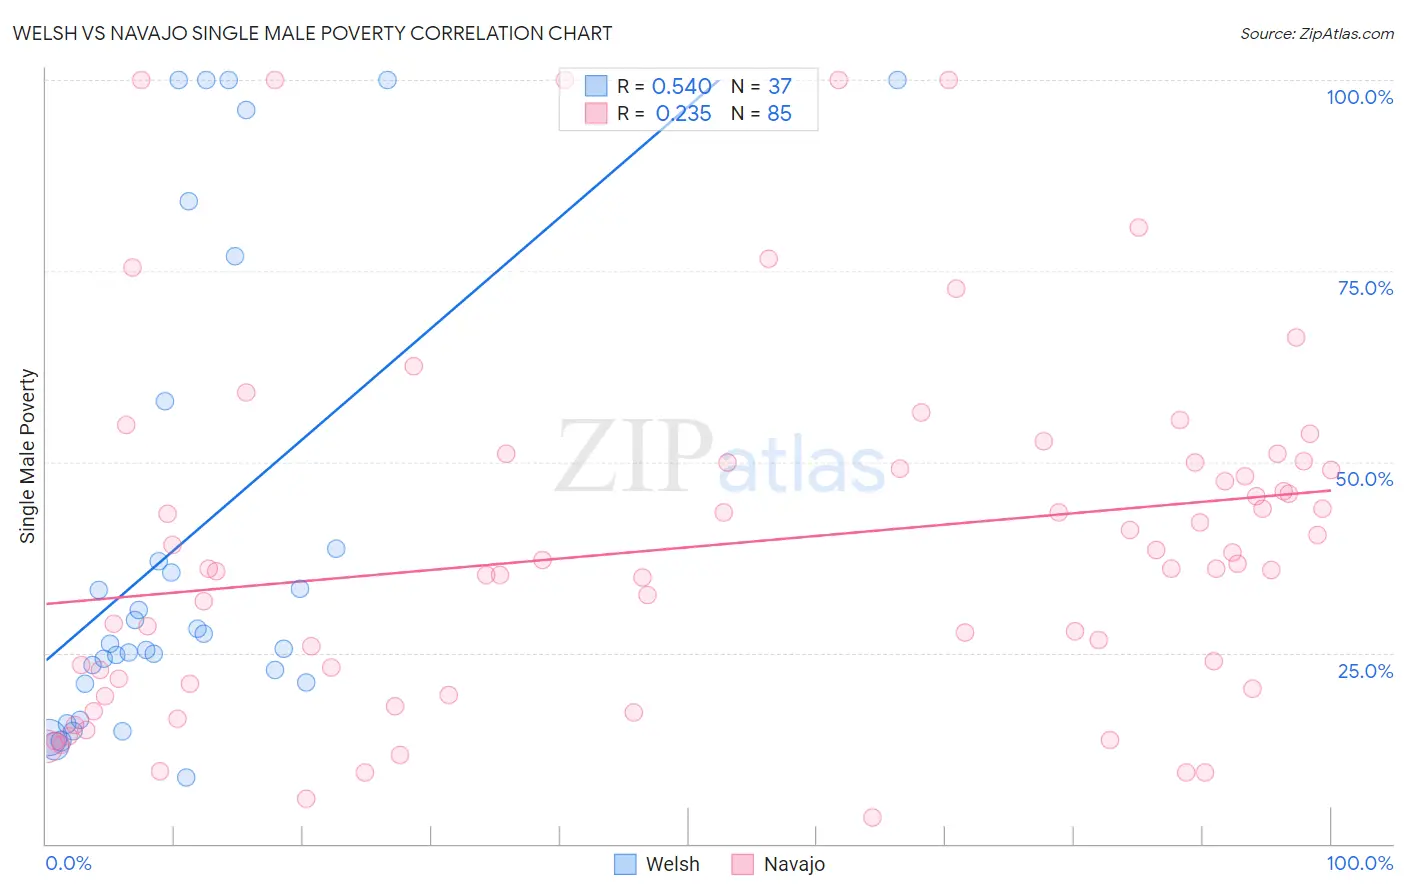
Welsh vs Navajo Single Male Poverty Correlation Chart
The statistical analysis conducted on geographies consisting of 442,898,896 people shows a substantial positive correlation between the proportion of Welsh and poverty level among single males in the United States with a correlation coefficient (R) of 0.540 and weighted average of 14.0%. Similarly, the statistical analysis conducted on geographies consisting of 210,717,973 people shows a weak positive correlation between the proportion of Navajo and poverty level among single males in the United States with a correlation coefficient (R) of 0.235 and weighted average of 25.3%, a difference of 80.6%.
Single Male Poverty Correlation Summary
| Measurement | Welsh | Navajo |
| Minimum | 8.7% | 3.4% |
| Maximum | 100.0% | 100.0% |
| Range | 91.3% | 96.6% |
| Mean | 40.1% | 39.0% |
| Median | 26.2% | 36.0% |
| Interquartile 25% (IQ1) | 21.0% | 20.6% |
| Interquartile 75% (IQ3) | 48.3% | 50.0% |
| Interquartile Range (IQR) | 27.3% | 29.4% |
| Standard Deviation (Sample) | 30.6% | 23.2% |
| Standard Deviation (Population) | 30.2% | 23.0% |
Similar Demographics by Single Male Poverty
Demographics Similar to Welsh by Single Male Poverty
In terms of single male poverty, the demographic groups most similar to Welsh are Honduran (14.0%, a difference of 0.13%), English (14.1%, a difference of 0.21%), Dutch (14.1%, a difference of 0.32%), Mexican (14.0%, a difference of 0.35%), and Immigrants from Honduras (14.1%, a difference of 0.36%).
| Demographics | Rating | Rank | Single Male Poverty |
| Immigrants | Cabo Verde | 0.1 /100 | #266 | Tragic 13.9% |
| Germans | 0.1 /100 | #267 | Tragic 13.9% |
| Immigrants | Mexico | 0.1 /100 | #268 | Tragic 13.9% |
| Scottish | 0.1 /100 | #269 | Tragic 14.0% |
| Immigrants | Saudi Arabia | 0.1 /100 | #270 | Tragic 14.0% |
| Irish | 0.1 /100 | #271 | Tragic 14.0% |
| Mexicans | 0.1 /100 | #272 | Tragic 14.0% |
| Welsh | 0.1 /100 | #273 | Tragic 14.0% |
| Hondurans | 0.1 /100 | #274 | Tragic 14.0% |
| English | 0.1 /100 | #275 | Tragic 14.1% |
| Dutch | 0.1 /100 | #276 | Tragic 14.1% |
| Immigrants | Honduras | 0.0 /100 | #277 | Tragic 14.1% |
| Slovaks | 0.0 /100 | #278 | Tragic 14.1% |
| Indonesians | 0.0 /100 | #279 | Tragic 14.1% |
| Hmong | 0.0 /100 | #280 | Tragic 14.2% |
Demographics Similar to Navajo by Single Male Poverty
In terms of single male poverty, the demographic groups most similar to Navajo are Lumbee (25.2%, a difference of 0.73%), Puerto Rican (25.1%, a difference of 1.1%), Houma (23.5%, a difference of 8.1%), Hopi (27.5%, a difference of 8.5%), and Crow (23.3%, a difference of 8.9%).
| Demographics | Rating | Rank | Single Male Poverty |
| Inupiat | 0.0 /100 | #333 | Tragic 20.0% |
| Pima | 0.0 /100 | #334 | Tragic 20.2% |
| Yuman | 0.0 /100 | #335 | Tragic 21.3% |
| Tohono O'odham | 0.0 /100 | #336 | Tragic 21.6% |
| Apache | 0.0 /100 | #337 | Tragic 21.6% |
| Pueblo | 0.0 /100 | #338 | Tragic 21.6% |
| Arapaho | 0.0 /100 | #339 | Tragic 21.9% |
| Sioux | 0.0 /100 | #340 | Tragic 22.2% |
| Crow | 0.0 /100 | #341 | Tragic 23.3% |
| Houma | 0.0 /100 | #342 | Tragic 23.5% |
| Puerto Ricans | 0.0 /100 | #343 | Tragic 25.1% |
| Lumbee | 0.0 /100 | #344 | Tragic 25.2% |
| Navajo | 0.0 /100 | #345 | Tragic 25.3% |
| Hopi | 0.0 /100 | #346 | Tragic 27.5% |
| Yup'ik | 0.0 /100 | #347 | Tragic 31.6% |