Welsh vs Navajo 2 or more Vehicles in Household
COMPARE
Welsh
Navajo
2 or more Vehicles in Household
2 or more Vehicles in Household Comparison
Welsh
Navajo
60.8%
2 OR MORE VEHICLES IN HOUSEHOLD
100.0/ 100
METRIC RATING
26th/ 347
METRIC RANK
55.3%
2 OR MORE VEHICLES IN HOUSEHOLD
50.0/ 100
METRIC RATING
174th/ 347
METRIC RANK
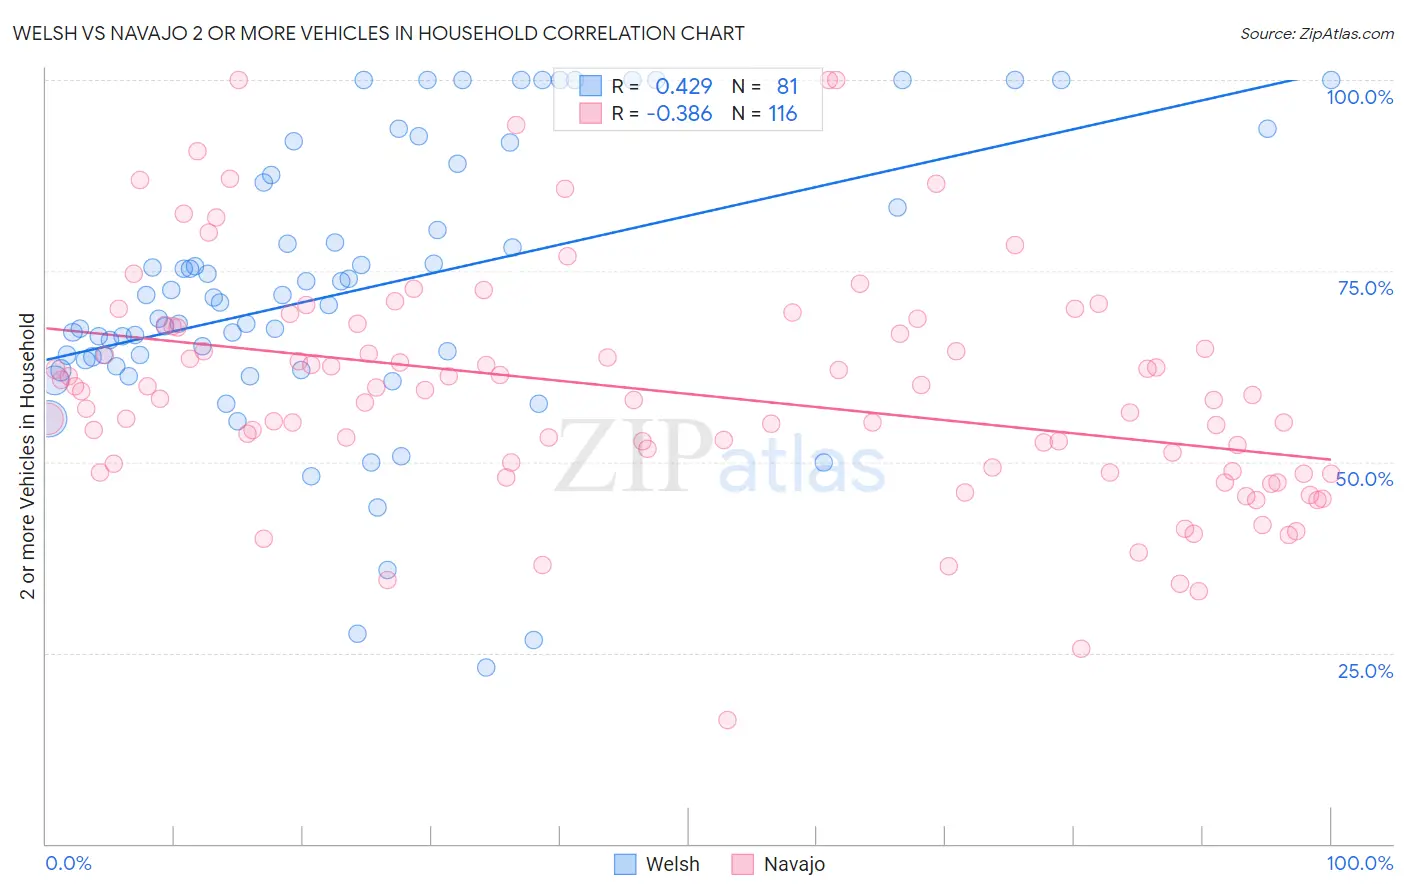
Welsh vs Navajo 2 or more Vehicles in Household Correlation Chart
The statistical analysis conducted on geographies consisting of 528,240,215 people shows a moderate positive correlation between the proportion of Welsh and percentage of households with 2 or more vehicles available in the United States with a correlation coefficient (R) of 0.429 and weighted average of 60.8%. Similarly, the statistical analysis conducted on geographies consisting of 224,763,782 people shows a mild negative correlation between the proportion of Navajo and percentage of households with 2 or more vehicles available in the United States with a correlation coefficient (R) of -0.386 and weighted average of 55.3%, a difference of 9.9%.
2 or more Vehicles in Household Correlation Summary
| Measurement | Welsh | Navajo |
| Minimum | 23.1% | 16.3% |
| Maximum | 100.0% | 100.0% |
| Range | 76.9% | 83.7% |
| Mean | 72.5% | 59.2% |
| Median | 70.9% | 58.5% |
| Interquartile 25% (IQ1) | 62.9% | 49.0% |
| Interquartile 75% (IQ3) | 87.0% | 67.7% |
| Interquartile Range (IQR) | 24.1% | 18.7% |
| Standard Deviation (Sample) | 18.2% | 15.1% |
| Standard Deviation (Population) | 18.1% | 15.1% |
Similar Demographics by 2 or more Vehicles in Household
Demographics Similar to Welsh by 2 or more Vehicles in Household
In terms of 2 or more vehicles in household, the demographic groups most similar to Welsh are White/Caucasian (60.8%, a difference of 0.050%), Immigrants from Vietnam (60.9%, a difference of 0.20%), Scotch-Irish (60.9%, a difference of 0.24%), Swiss (61.0%, a difference of 0.28%), and Korean (61.0%, a difference of 0.31%).
| Demographics | Rating | Rank | 2 or more Vehicles in Household |
| Scottish | 100.0 /100 | #19 | Exceptional 61.2% |
| Sri Lankans | 100.0 /100 | #20 | Exceptional 61.0% |
| Koreans | 100.0 /100 | #21 | Exceptional 61.0% |
| Swiss | 100.0 /100 | #22 | Exceptional 61.0% |
| Scotch-Irish | 100.0 /100 | #23 | Exceptional 60.9% |
| Immigrants | Vietnam | 100.0 /100 | #24 | Exceptional 60.9% |
| Whites/Caucasians | 100.0 /100 | #25 | Exceptional 60.8% |
| Welsh | 100.0 /100 | #26 | Exceptional 60.8% |
| Assyrians/Chaldeans/Syriacs | 100.0 /100 | #27 | Exceptional 60.5% |
| Guamanians/Chamorros | 100.0 /100 | #28 | Exceptional 60.5% |
| Hawaiians | 100.0 /100 | #29 | Exceptional 60.4% |
| Finns | 100.0 /100 | #30 | Exceptional 60.3% |
| Spanish American Indians | 100.0 /100 | #31 | Exceptional 60.3% |
| Arapaho | 100.0 /100 | #32 | Exceptional 60.2% |
| Immigrants | Mexico | 100.0 /100 | #33 | Exceptional 60.2% |
Demographics Similar to Navajo by 2 or more Vehicles in Household
In terms of 2 or more vehicles in household, the demographic groups most similar to Navajo are Immigrants from Denmark (55.3%, a difference of 0.020%), Immigrants from Western Europe (55.4%, a difference of 0.050%), Immigrants from Nicaragua (55.4%, a difference of 0.070%), Immigrants from Cuba (55.3%, a difference of 0.12%), and Menominee (55.3%, a difference of 0.15%).
| Demographics | Rating | Rank | 2 or more Vehicles in Household |
| Kenyans | 58.1 /100 | #167 | Average 55.5% |
| French American Indians | 56.7 /100 | #168 | Average 55.5% |
| Immigrants | Austria | 56.3 /100 | #169 | Average 55.5% |
| Romanians | 55.8 /100 | #170 | Average 55.5% |
| Immigrants | Costa Rica | 54.4 /100 | #171 | Average 55.4% |
| Immigrants | Nicaragua | 51.6 /100 | #172 | Average 55.4% |
| Immigrants | Western Europe | 51.4 /100 | #173 | Average 55.4% |
| Navajo | 50.0 /100 | #174 | Average 55.3% |
| Immigrants | Denmark | 49.4 /100 | #175 | Average 55.3% |
| Immigrants | Cuba | 47.0 /100 | #176 | Average 55.3% |
| Menominee | 46.2 /100 | #177 | Average 55.3% |
| Immigrants | Sweden | 45.3 /100 | #178 | Average 55.2% |
| Alaskan Athabascans | 42.9 /100 | #179 | Average 55.2% |
| Immigrants | Kenya | 40.4 /100 | #180 | Average 55.1% |
| Immigrants | Micronesia | 38.2 /100 | #181 | Fair 55.1% |