Welsh vs Dominican Single Male Poverty
COMPARE
Welsh
Dominican
Single Male Poverty
Single Male Poverty Comparison
Welsh
Dominicans
14.0%
SINGLE MALE POVERTY
0.1/ 100
METRIC RATING
273rd/ 347
METRIC RANK
15.2%
SINGLE MALE POVERTY
0.0/ 100
METRIC RATING
301st/ 347
METRIC RANK
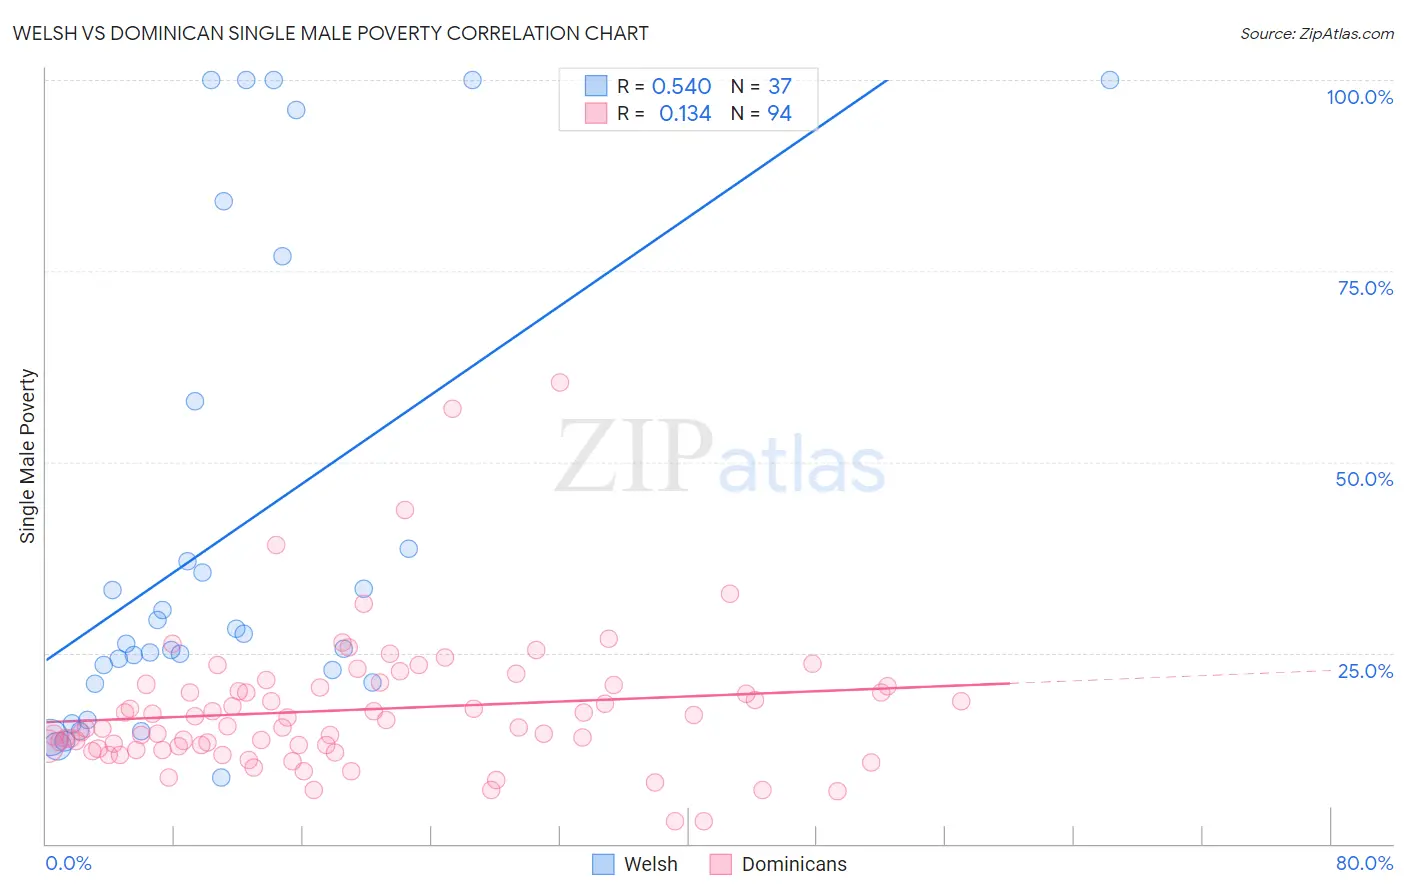
Welsh vs Dominican Single Male Poverty Correlation Chart
The statistical analysis conducted on geographies consisting of 442,898,896 people shows a substantial positive correlation between the proportion of Welsh and poverty level among single males in the United States with a correlation coefficient (R) of 0.540 and weighted average of 14.0%. Similarly, the statistical analysis conducted on geographies consisting of 318,233,165 people shows a poor positive correlation between the proportion of Dominicans and poverty level among single males in the United States with a correlation coefficient (R) of 0.134 and weighted average of 15.2%, a difference of 8.5%.
Single Male Poverty Correlation Summary
| Measurement | Welsh | Dominican |
| Minimum | 8.7% | 2.9% |
| Maximum | 100.0% | 60.5% |
| Range | 91.3% | 57.6% |
| Mean | 40.1% | 17.6% |
| Median | 26.2% | 15.4% |
| Interquartile 25% (IQ1) | 21.0% | 12.8% |
| Interquartile 75% (IQ3) | 48.3% | 20.6% |
| Interquartile Range (IQR) | 27.3% | 7.8% |
| Standard Deviation (Sample) | 30.6% | 9.1% |
| Standard Deviation (Population) | 30.2% | 9.1% |
Similar Demographics by Single Male Poverty
Demographics Similar to Welsh by Single Male Poverty
In terms of single male poverty, the demographic groups most similar to Welsh are Honduran (14.0%, a difference of 0.13%), English (14.1%, a difference of 0.21%), Dutch (14.1%, a difference of 0.32%), Mexican (14.0%, a difference of 0.35%), and Immigrants from Honduras (14.1%, a difference of 0.36%).
| Demographics | Rating | Rank | Single Male Poverty |
| Immigrants | Cabo Verde | 0.1 /100 | #266 | Tragic 13.9% |
| Germans | 0.1 /100 | #267 | Tragic 13.9% |
| Immigrants | Mexico | 0.1 /100 | #268 | Tragic 13.9% |
| Scottish | 0.1 /100 | #269 | Tragic 14.0% |
| Immigrants | Saudi Arabia | 0.1 /100 | #270 | Tragic 14.0% |
| Irish | 0.1 /100 | #271 | Tragic 14.0% |
| Mexicans | 0.1 /100 | #272 | Tragic 14.0% |
| Welsh | 0.1 /100 | #273 | Tragic 14.0% |
| Hondurans | 0.1 /100 | #274 | Tragic 14.0% |
| English | 0.1 /100 | #275 | Tragic 14.1% |
| Dutch | 0.1 /100 | #276 | Tragic 14.1% |
| Immigrants | Honduras | 0.0 /100 | #277 | Tragic 14.1% |
| Slovaks | 0.0 /100 | #278 | Tragic 14.1% |
| Indonesians | 0.0 /100 | #279 | Tragic 14.1% |
| Hmong | 0.0 /100 | #280 | Tragic 14.2% |
Demographics Similar to Dominicans by Single Male Poverty
In terms of single male poverty, the demographic groups most similar to Dominicans are Alsatian (15.2%, a difference of 0.16%), Cree (15.1%, a difference of 0.82%), Aleut (15.4%, a difference of 1.2%), Delaware (15.0%, a difference of 1.3%), and Alaska Native (15.4%, a difference of 1.3%).
| Demographics | Rating | Rank | Single Male Poverty |
| Ottawa | 0.0 /100 | #294 | Tragic 14.6% |
| Scotch-Irish | 0.0 /100 | #295 | Tragic 14.7% |
| Africans | 0.0 /100 | #296 | Tragic 14.7% |
| Immigrants | Dominican Republic | 0.0 /100 | #297 | Tragic 14.8% |
| French American Indians | 0.0 /100 | #298 | Tragic 15.0% |
| Delaware | 0.0 /100 | #299 | Tragic 15.0% |
| Cree | 0.0 /100 | #300 | Tragic 15.1% |
| Dominicans | 0.0 /100 | #301 | Tragic 15.2% |
| Alsatians | 0.0 /100 | #302 | Tragic 15.2% |
| Aleuts | 0.0 /100 | #303 | Tragic 15.4% |
| Alaska Natives | 0.0 /100 | #304 | Tragic 15.4% |
| Blackfeet | 0.0 /100 | #305 | Tragic 15.5% |
| Pennsylvania Germans | 0.0 /100 | #306 | Tragic 15.6% |
| Ute | 0.0 /100 | #307 | Tragic 15.7% |
| Potawatomi | 0.0 /100 | #308 | Tragic 15.8% |