Ethiopian vs Navajo Single Male Poverty
COMPARE
Ethiopian
Navajo
Single Male Poverty
Single Male Poverty Comparison
Ethiopians
Navajo
11.2%
SINGLE MALE POVERTY
100.0/ 100
METRIC RATING
20th/ 347
METRIC RANK
25.3%
SINGLE MALE POVERTY
0.0/ 100
METRIC RATING
345th/ 347
METRIC RANK
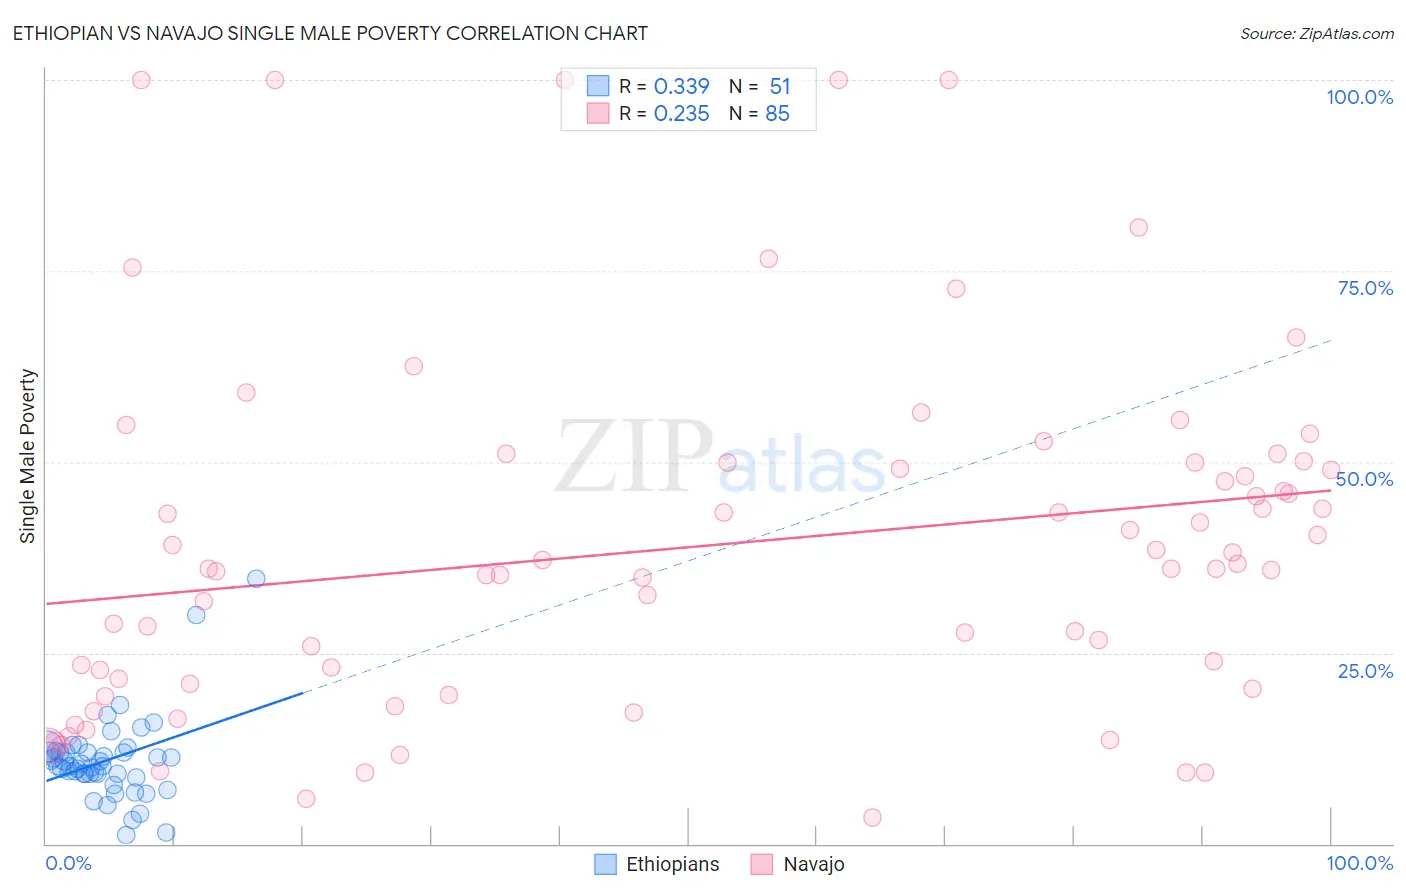
Ethiopian vs Navajo Single Male Poverty Correlation Chart
The statistical analysis conducted on geographies consisting of 207,684,975 people shows a mild positive correlation between the proportion of Ethiopians and poverty level among single males in the United States with a correlation coefficient (R) of 0.339 and weighted average of 11.2%. Similarly, the statistical analysis conducted on geographies consisting of 210,717,973 people shows a weak positive correlation between the proportion of Navajo and poverty level among single males in the United States with a correlation coefficient (R) of 0.235 and weighted average of 25.3%, a difference of 127.0%.
Single Male Poverty Correlation Summary
| Measurement | Ethiopian | Navajo |
| Minimum | 1.1% | 3.4% |
| Maximum | 34.7% | 100.0% |
| Range | 33.6% | 96.6% |
| Mean | 10.9% | 39.0% |
| Median | 10.2% | 36.0% |
| Interquartile 25% (IQ1) | 9.1% | 20.6% |
| Interquartile 75% (IQ3) | 11.9% | 50.0% |
| Interquartile Range (IQR) | 2.8% | 29.4% |
| Standard Deviation (Sample) | 5.6% | 23.2% |
| Standard Deviation (Population) | 5.5% | 23.0% |
Similar Demographics by Single Male Poverty
Demographics Similar to Ethiopians by Single Male Poverty
In terms of single male poverty, the demographic groups most similar to Ethiopians are Immigrants from Moldova (11.2%, a difference of 0.020%), Asian (11.2%, a difference of 0.34%), Immigrants from Bolivia (11.1%, a difference of 0.41%), Immigrants from Pakistan (11.2%, a difference of 0.44%), and Bolivian (11.2%, a difference of 0.65%).
| Demographics | Rating | Rank | Single Male Poverty |
| Immigrants | South Central Asia | 100.0 /100 | #13 | Exceptional 10.9% |
| Chinese | 100.0 /100 | #14 | Exceptional 11.0% |
| Koreans | 100.0 /100 | #15 | Exceptional 11.0% |
| Bhutanese | 100.0 /100 | #16 | Exceptional 11.1% |
| Tsimshian | 100.0 /100 | #17 | Exceptional 11.1% |
| Immigrants | Bolivia | 100.0 /100 | #18 | Exceptional 11.1% |
| Immigrants | Moldova | 100.0 /100 | #19 | Exceptional 11.2% |
| Ethiopians | 100.0 /100 | #20 | Exceptional 11.2% |
| Asians | 100.0 /100 | #21 | Exceptional 11.2% |
| Immigrants | Pakistan | 100.0 /100 | #22 | Exceptional 11.2% |
| Bolivians | 100.0 /100 | #23 | Exceptional 11.2% |
| Indians (Asian) | 100.0 /100 | #24 | Exceptional 11.3% |
| Maltese | 100.0 /100 | #25 | Exceptional 11.3% |
| Immigrants | Japan | 100.0 /100 | #26 | Exceptional 11.3% |
| Immigrants | China | 100.0 /100 | #27 | Exceptional 11.4% |
Demographics Similar to Navajo by Single Male Poverty
In terms of single male poverty, the demographic groups most similar to Navajo are Lumbee (25.2%, a difference of 0.73%), Puerto Rican (25.1%, a difference of 1.1%), Houma (23.5%, a difference of 8.1%), Hopi (27.5%, a difference of 8.5%), and Crow (23.3%, a difference of 8.9%).
| Demographics | Rating | Rank | Single Male Poverty |
| Inupiat | 0.0 /100 | #333 | Tragic 20.0% |
| Pima | 0.0 /100 | #334 | Tragic 20.2% |
| Yuman | 0.0 /100 | #335 | Tragic 21.3% |
| Tohono O'odham | 0.0 /100 | #336 | Tragic 21.6% |
| Apache | 0.0 /100 | #337 | Tragic 21.6% |
| Pueblo | 0.0 /100 | #338 | Tragic 21.6% |
| Arapaho | 0.0 /100 | #339 | Tragic 21.9% |
| Sioux | 0.0 /100 | #340 | Tragic 22.2% |
| Crow | 0.0 /100 | #341 | Tragic 23.3% |
| Houma | 0.0 /100 | #342 | Tragic 23.5% |
| Puerto Ricans | 0.0 /100 | #343 | Tragic 25.1% |
| Lumbee | 0.0 /100 | #344 | Tragic 25.2% |
| Navajo | 0.0 /100 | #345 | Tragic 25.3% |
| Hopi | 0.0 /100 | #346 | Tragic 27.5% |
| Yup'ik | 0.0 /100 | #347 | Tragic 31.6% |