Welsh vs Immigrants from Kuwait Single Male Poverty
COMPARE
Welsh
Immigrants from Kuwait
Single Male Poverty
Single Male Poverty Comparison
Welsh
Immigrants from Kuwait
14.0%
SINGLE MALE POVERTY
0.1/ 100
METRIC RATING
273rd/ 347
METRIC RANK
12.9%
SINGLE MALE POVERTY
31.9/ 100
METRIC RATING
187th/ 347
METRIC RANK
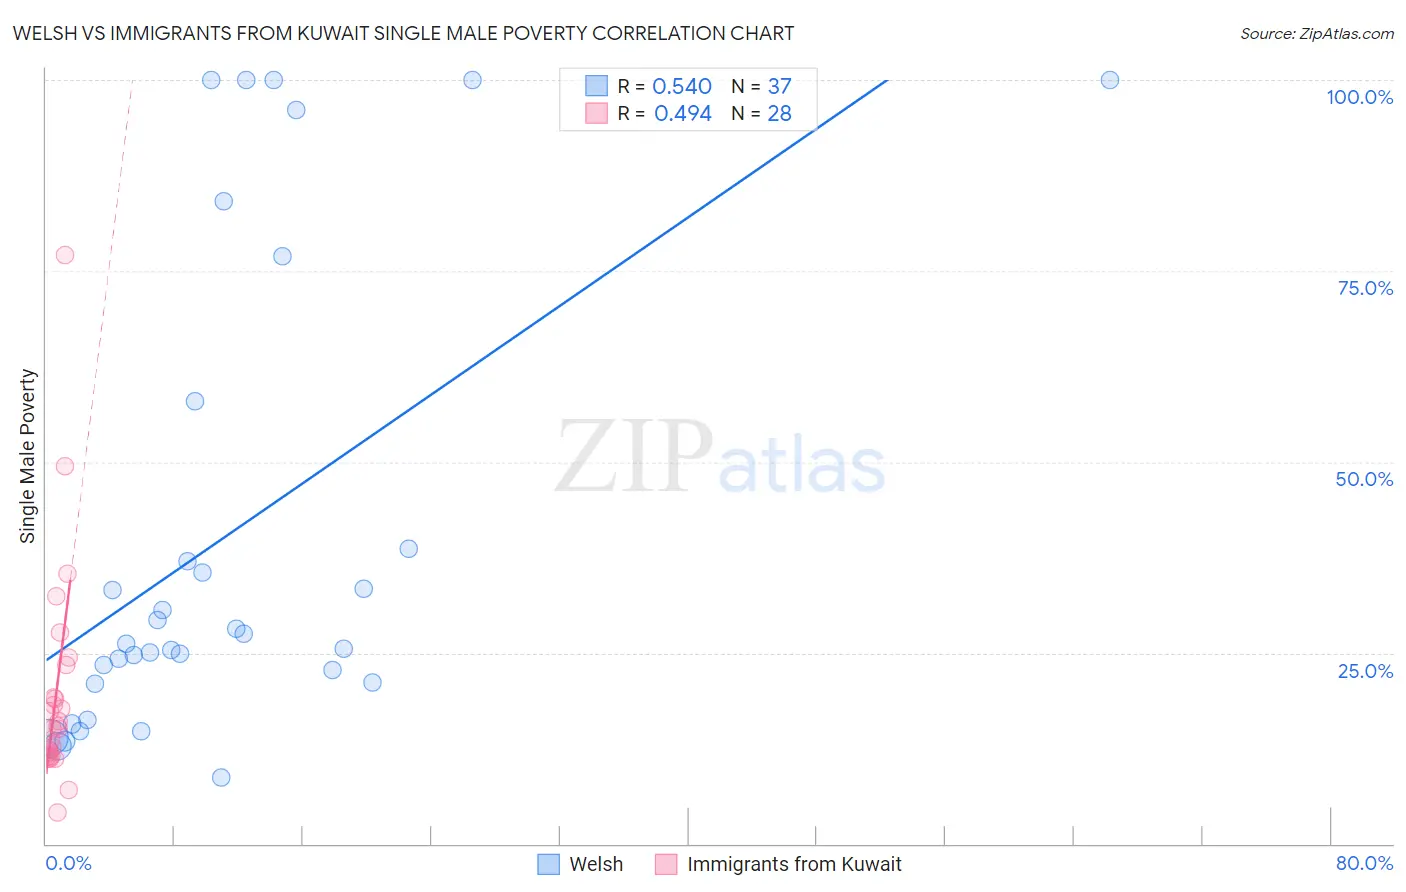
Welsh vs Immigrants from Kuwait Single Male Poverty Correlation Chart
The statistical analysis conducted on geographies consisting of 442,898,896 people shows a substantial positive correlation between the proportion of Welsh and poverty level among single males in the United States with a correlation coefficient (R) of 0.540 and weighted average of 14.0%. Similarly, the statistical analysis conducted on geographies consisting of 129,103,469 people shows a moderate positive correlation between the proportion of Immigrants from Kuwait and poverty level among single males in the United States with a correlation coefficient (R) of 0.494 and weighted average of 12.9%, a difference of 8.6%.
Single Male Poverty Correlation Summary
| Measurement | Welsh | Immigrants from Kuwait |
| Minimum | 8.7% | 4.1% |
| Maximum | 100.0% | 77.0% |
| Range | 91.3% | 73.0% |
| Mean | 40.1% | 19.7% |
| Median | 26.2% | 15.2% |
| Interquartile 25% (IQ1) | 21.0% | 11.7% |
| Interquartile 75% (IQ3) | 48.3% | 21.3% |
| Interquartile Range (IQR) | 27.3% | 9.6% |
| Standard Deviation (Sample) | 30.6% | 14.6% |
| Standard Deviation (Population) | 30.2% | 14.4% |
Similar Demographics by Single Male Poverty
Demographics Similar to Welsh by Single Male Poverty
In terms of single male poverty, the demographic groups most similar to Welsh are Honduran (14.0%, a difference of 0.13%), English (14.1%, a difference of 0.21%), Dutch (14.1%, a difference of 0.32%), Mexican (14.0%, a difference of 0.35%), and Immigrants from Honduras (14.1%, a difference of 0.36%).
| Demographics | Rating | Rank | Single Male Poverty |
| Immigrants | Cabo Verde | 0.1 /100 | #266 | Tragic 13.9% |
| Germans | 0.1 /100 | #267 | Tragic 13.9% |
| Immigrants | Mexico | 0.1 /100 | #268 | Tragic 13.9% |
| Scottish | 0.1 /100 | #269 | Tragic 14.0% |
| Immigrants | Saudi Arabia | 0.1 /100 | #270 | Tragic 14.0% |
| Irish | 0.1 /100 | #271 | Tragic 14.0% |
| Mexicans | 0.1 /100 | #272 | Tragic 14.0% |
| Welsh | 0.1 /100 | #273 | Tragic 14.0% |
| Hondurans | 0.1 /100 | #274 | Tragic 14.0% |
| English | 0.1 /100 | #275 | Tragic 14.1% |
| Dutch | 0.1 /100 | #276 | Tragic 14.1% |
| Immigrants | Honduras | 0.0 /100 | #277 | Tragic 14.1% |
| Slovaks | 0.0 /100 | #278 | Tragic 14.1% |
| Indonesians | 0.0 /100 | #279 | Tragic 14.1% |
| Hmong | 0.0 /100 | #280 | Tragic 14.2% |
Demographics Similar to Immigrants from Kuwait by Single Male Poverty
In terms of single male poverty, the demographic groups most similar to Immigrants from Kuwait are Nigerian (12.9%, a difference of 0.0%), Norwegian (12.9%, a difference of 0.010%), Macedonian (12.9%, a difference of 0.020%), Immigrants from Trinidad and Tobago (12.9%, a difference of 0.040%), and Immigrants from West Indies (12.9%, a difference of 0.060%).
| Demographics | Rating | Rank | Single Male Poverty |
| Immigrants | North America | 37.7 /100 | #180 | Fair 12.9% |
| Panamanians | 37.6 /100 | #181 | Fair 12.9% |
| Moroccans | 36.8 /100 | #182 | Fair 12.9% |
| Immigrants | West Indies | 33.0 /100 | #183 | Fair 12.9% |
| Immigrants | Trinidad and Tobago | 32.5 /100 | #184 | Fair 12.9% |
| Norwegians | 32.0 /100 | #185 | Fair 12.9% |
| Nigerians | 31.9 /100 | #186 | Fair 12.9% |
| Immigrants | Kuwait | 31.9 /100 | #187 | Fair 12.9% |
| Macedonians | 31.5 /100 | #188 | Fair 12.9% |
| Portuguese | 30.2 /100 | #189 | Fair 12.9% |
| Arabs | 27.0 /100 | #190 | Fair 13.0% |
| Immigrants | Thailand | 26.6 /100 | #191 | Fair 13.0% |
| Immigrants | Jamaica | 26.5 /100 | #192 | Fair 13.0% |
| Immigrants | South Africa | 26.1 /100 | #193 | Fair 13.0% |
| Liberians | 25.2 /100 | #194 | Fair 13.0% |