Nonimmigrants vs Navajo Single Male Poverty
COMPARE
Nonimmigrants
Navajo
Single Male Poverty
Single Male Poverty Comparison
Nonimmigrants
Navajo
14.6%
SINGLE MALE POVERTY
0.0/ 100
METRIC RATING
292nd/ 347
METRIC RANK
25.3%
SINGLE MALE POVERTY
0.0/ 100
METRIC RATING
345th/ 347
METRIC RANK
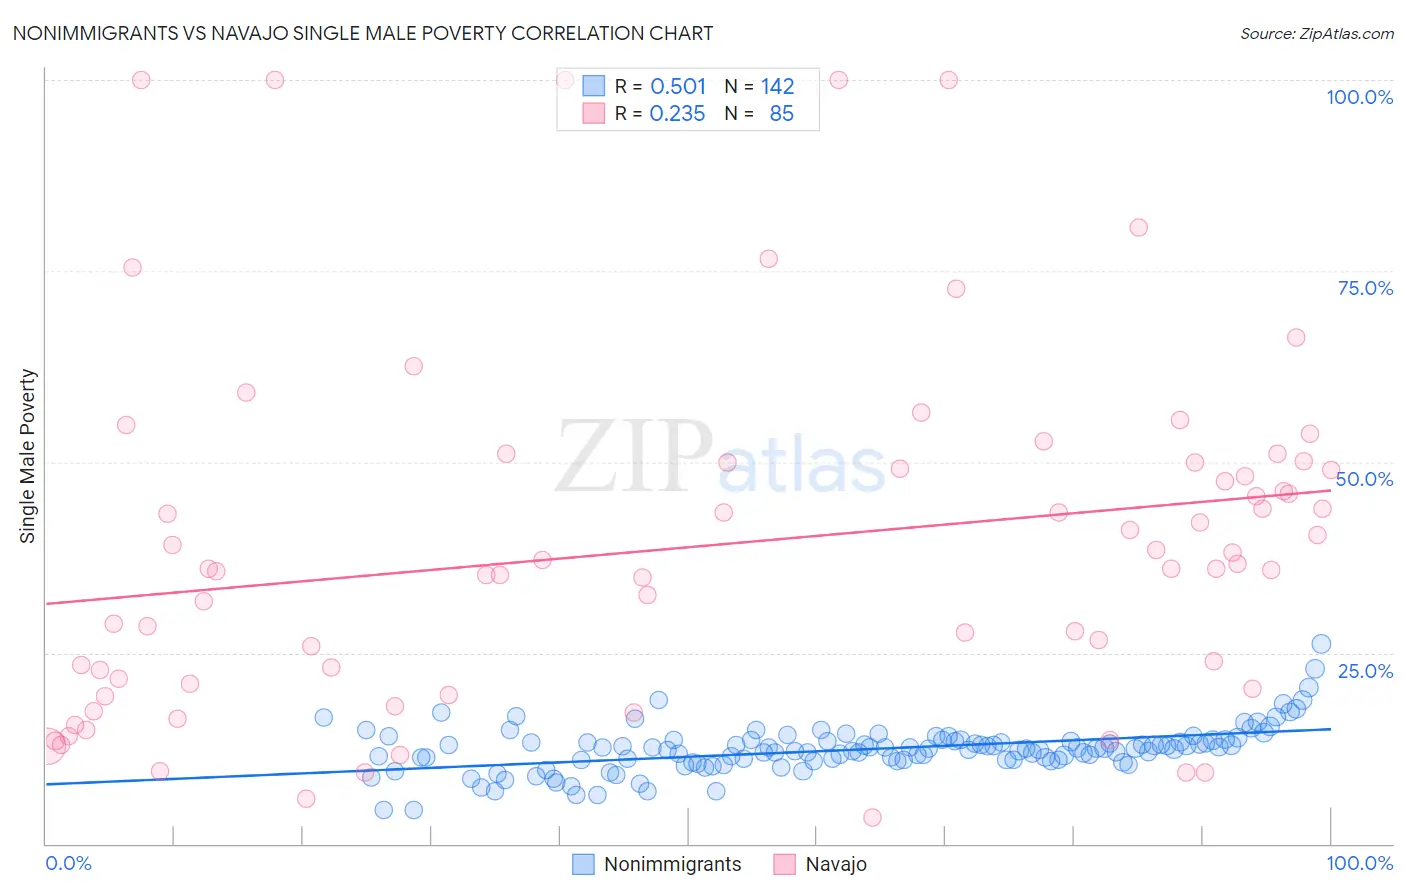
Nonimmigrants vs Navajo Single Male Poverty Correlation Chart
The statistical analysis conducted on geographies consisting of 470,347,723 people shows a substantial positive correlation between the proportion of Nonimmigrants and poverty level among single males in the United States with a correlation coefficient (R) of 0.501 and weighted average of 14.6%. Similarly, the statistical analysis conducted on geographies consisting of 210,717,973 people shows a weak positive correlation between the proportion of Navajo and poverty level among single males in the United States with a correlation coefficient (R) of 0.235 and weighted average of 25.3%, a difference of 73.9%.
Single Male Poverty Correlation Summary
| Measurement | Nonimmigrants | Navajo |
| Minimum | 4.4% | 3.4% |
| Maximum | 26.2% | 100.0% |
| Range | 21.8% | 96.6% |
| Mean | 12.4% | 39.0% |
| Median | 12.5% | 36.0% |
| Interquartile 25% (IQ1) | 11.0% | 20.6% |
| Interquartile 75% (IQ3) | 13.5% | 50.0% |
| Interquartile Range (IQR) | 2.5% | 29.4% |
| Standard Deviation (Sample) | 3.1% | 23.2% |
| Standard Deviation (Population) | 3.1% | 23.0% |
Similar Demographics by Single Male Poverty
Demographics Similar to Nonimmigrants by Single Male Poverty
In terms of single male poverty, the demographic groups most similar to Nonimmigrants are French Canadian (14.6%, a difference of 0.11%), Bahamian (14.6%, a difference of 0.13%), U.S. Virgin Islander (14.5%, a difference of 0.28%), Ottawa (14.6%, a difference of 0.30%), and Immigrants from Dominica (14.5%, a difference of 0.51%).
| Demographics | Rating | Rank | Single Male Poverty |
| French | 0.0 /100 | #285 | Tragic 14.4% |
| Celtics | 0.0 /100 | #286 | Tragic 14.5% |
| Iroquois | 0.0 /100 | #287 | Tragic 14.5% |
| Whites/Caucasians | 0.0 /100 | #288 | Tragic 14.5% |
| Immigrants | Dominica | 0.0 /100 | #289 | Tragic 14.5% |
| U.S. Virgin Islanders | 0.0 /100 | #290 | Tragic 14.5% |
| Bahamians | 0.0 /100 | #291 | Tragic 14.6% |
| Immigrants | Nonimmigrants | 0.0 /100 | #292 | Tragic 14.6% |
| French Canadians | 0.0 /100 | #293 | Tragic 14.6% |
| Ottawa | 0.0 /100 | #294 | Tragic 14.6% |
| Scotch-Irish | 0.0 /100 | #295 | Tragic 14.7% |
| Africans | 0.0 /100 | #296 | Tragic 14.7% |
| Immigrants | Dominican Republic | 0.0 /100 | #297 | Tragic 14.8% |
| French American Indians | 0.0 /100 | #298 | Tragic 15.0% |
| Delaware | 0.0 /100 | #299 | Tragic 15.0% |
Demographics Similar to Navajo by Single Male Poverty
In terms of single male poverty, the demographic groups most similar to Navajo are Lumbee (25.2%, a difference of 0.73%), Puerto Rican (25.1%, a difference of 1.1%), Houma (23.5%, a difference of 8.1%), Hopi (27.5%, a difference of 8.5%), and Crow (23.3%, a difference of 8.9%).
| Demographics | Rating | Rank | Single Male Poverty |
| Inupiat | 0.0 /100 | #333 | Tragic 20.0% |
| Pima | 0.0 /100 | #334 | Tragic 20.2% |
| Yuman | 0.0 /100 | #335 | Tragic 21.3% |
| Tohono O'odham | 0.0 /100 | #336 | Tragic 21.6% |
| Apache | 0.0 /100 | #337 | Tragic 21.6% |
| Pueblo | 0.0 /100 | #338 | Tragic 21.6% |
| Arapaho | 0.0 /100 | #339 | Tragic 21.9% |
| Sioux | 0.0 /100 | #340 | Tragic 22.2% |
| Crow | 0.0 /100 | #341 | Tragic 23.3% |
| Houma | 0.0 /100 | #342 | Tragic 23.5% |
| Puerto Ricans | 0.0 /100 | #343 | Tragic 25.1% |
| Lumbee | 0.0 /100 | #344 | Tragic 25.2% |
| Navajo | 0.0 /100 | #345 | Tragic 25.3% |
| Hopi | 0.0 /100 | #346 | Tragic 27.5% |
| Yup'ik | 0.0 /100 | #347 | Tragic 31.6% |