Nigerian vs Navajo Single Male Poverty
COMPARE
Nigerian
Navajo
Single Male Poverty
Single Male Poverty Comparison
Nigerians
Navajo
12.9%
SINGLE MALE POVERTY
31.9/ 100
METRIC RATING
186th/ 347
METRIC RANK
25.3%
SINGLE MALE POVERTY
0.0/ 100
METRIC RATING
345th/ 347
METRIC RANK
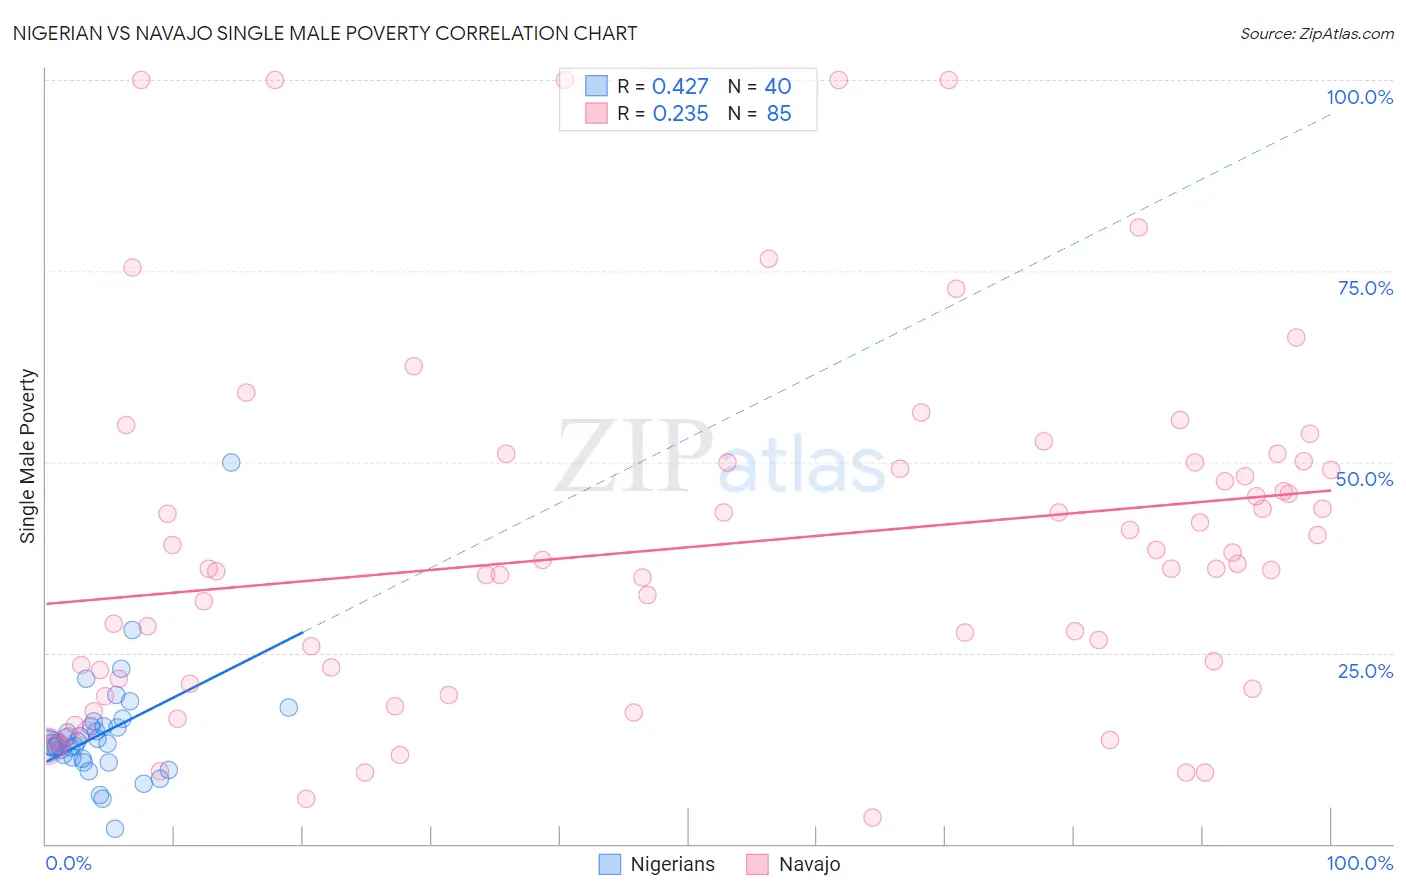
Nigerian vs Navajo Single Male Poverty Correlation Chart
The statistical analysis conducted on geographies consisting of 304,027,429 people shows a moderate positive correlation between the proportion of Nigerians and poverty level among single males in the United States with a correlation coefficient (R) of 0.427 and weighted average of 12.9%. Similarly, the statistical analysis conducted on geographies consisting of 210,717,973 people shows a weak positive correlation between the proportion of Navajo and poverty level among single males in the United States with a correlation coefficient (R) of 0.235 and weighted average of 25.3%, a difference of 96.0%.
Single Male Poverty Correlation Summary
| Measurement | Nigerian | Navajo |
| Minimum | 1.9% | 3.4% |
| Maximum | 50.0% | 100.0% |
| Range | 48.1% | 96.6% |
| Mean | 14.4% | 39.0% |
| Median | 13.2% | 36.0% |
| Interquartile 25% (IQ1) | 11.2% | 20.6% |
| Interquartile 75% (IQ3) | 15.4% | 50.0% |
| Interquartile Range (IQR) | 4.2% | 29.4% |
| Standard Deviation (Sample) | 7.4% | 23.2% |
| Standard Deviation (Population) | 7.3% | 23.0% |
Similar Demographics by Single Male Poverty
Demographics Similar to Nigerians by Single Male Poverty
In terms of single male poverty, the demographic groups most similar to Nigerians are Norwegian (12.9%, a difference of 0.0%), Immigrants from Kuwait (12.9%, a difference of 0.0%), Immigrants from Trinidad and Tobago (12.9%, a difference of 0.030%), Macedonian (12.9%, a difference of 0.030%), and Immigrants from West Indies (12.9%, a difference of 0.060%).
| Demographics | Rating | Rank | Single Male Poverty |
| Israelis | 41.0 /100 | #179 | Average 12.9% |
| Immigrants | North America | 37.7 /100 | #180 | Fair 12.9% |
| Panamanians | 37.6 /100 | #181 | Fair 12.9% |
| Moroccans | 36.8 /100 | #182 | Fair 12.9% |
| Immigrants | West Indies | 33.0 /100 | #183 | Fair 12.9% |
| Immigrants | Trinidad and Tobago | 32.5 /100 | #184 | Fair 12.9% |
| Norwegians | 32.0 /100 | #185 | Fair 12.9% |
| Nigerians | 31.9 /100 | #186 | Fair 12.9% |
| Immigrants | Kuwait | 31.9 /100 | #187 | Fair 12.9% |
| Macedonians | 31.5 /100 | #188 | Fair 12.9% |
| Portuguese | 30.2 /100 | #189 | Fair 12.9% |
| Arabs | 27.0 /100 | #190 | Fair 13.0% |
| Immigrants | Thailand | 26.6 /100 | #191 | Fair 13.0% |
| Immigrants | Jamaica | 26.5 /100 | #192 | Fair 13.0% |
| Immigrants | South Africa | 26.1 /100 | #193 | Fair 13.0% |
Demographics Similar to Navajo by Single Male Poverty
In terms of single male poverty, the demographic groups most similar to Navajo are Lumbee (25.2%, a difference of 0.73%), Puerto Rican (25.1%, a difference of 1.1%), Houma (23.5%, a difference of 8.1%), Hopi (27.5%, a difference of 8.5%), and Crow (23.3%, a difference of 8.9%).
| Demographics | Rating | Rank | Single Male Poverty |
| Inupiat | 0.0 /100 | #333 | Tragic 20.0% |
| Pima | 0.0 /100 | #334 | Tragic 20.2% |
| Yuman | 0.0 /100 | #335 | Tragic 21.3% |
| Tohono O'odham | 0.0 /100 | #336 | Tragic 21.6% |
| Apache | 0.0 /100 | #337 | Tragic 21.6% |
| Pueblo | 0.0 /100 | #338 | Tragic 21.6% |
| Arapaho | 0.0 /100 | #339 | Tragic 21.9% |
| Sioux | 0.0 /100 | #340 | Tragic 22.2% |
| Crow | 0.0 /100 | #341 | Tragic 23.3% |
| Houma | 0.0 /100 | #342 | Tragic 23.5% |
| Puerto Ricans | 0.0 /100 | #343 | Tragic 25.1% |
| Lumbee | 0.0 /100 | #344 | Tragic 25.2% |
| Navajo | 0.0 /100 | #345 | Tragic 25.3% |
| Hopi | 0.0 /100 | #346 | Tragic 27.5% |
| Yup'ik | 0.0 /100 | #347 | Tragic 31.6% |