Welsh vs Nepalese Single Male Poverty
COMPARE
Welsh
Nepalese
Single Male Poverty
Single Male Poverty Comparison
Welsh
Nepalese
14.0%
SINGLE MALE POVERTY
0.1/ 100
METRIC RATING
273rd/ 347
METRIC RANK
11.6%
SINGLE MALE POVERTY
99.9/ 100
METRIC RATING
47th/ 347
METRIC RANK
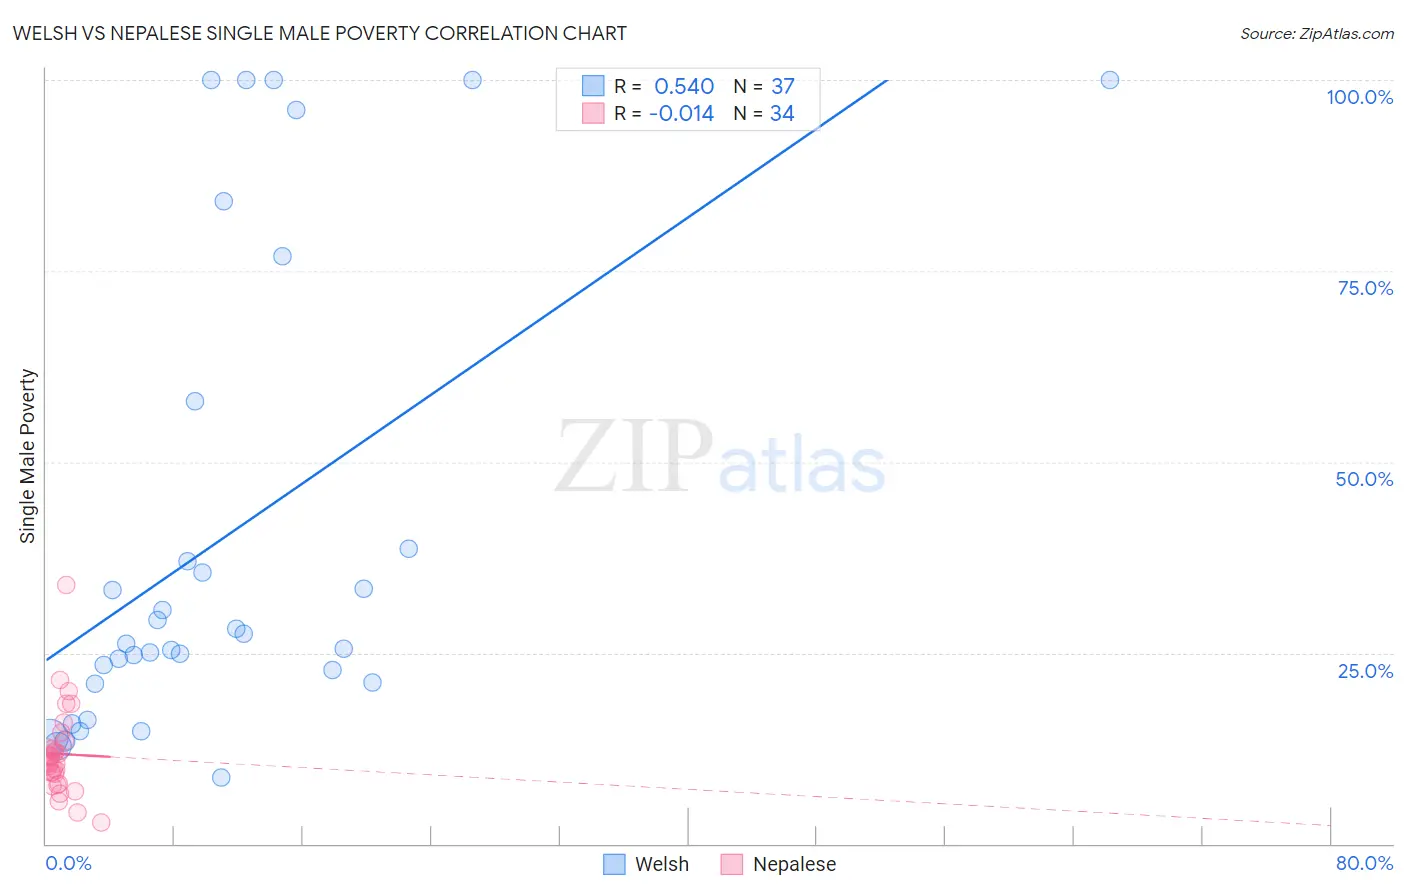
Welsh vs Nepalese Single Male Poverty Correlation Chart
The statistical analysis conducted on geographies consisting of 442,898,896 people shows a substantial positive correlation between the proportion of Welsh and poverty level among single males in the United States with a correlation coefficient (R) of 0.540 and weighted average of 14.0%. Similarly, the statistical analysis conducted on geographies consisting of 24,210,854 people shows no correlation between the proportion of Nepalese and poverty level among single males in the United States with a correlation coefficient (R) of -0.014 and weighted average of 11.6%, a difference of 21.1%.
Single Male Poverty Correlation Summary
| Measurement | Welsh | Nepalese |
| Minimum | 8.7% | 2.8% |
| Maximum | 100.0% | 33.9% |
| Range | 91.3% | 31.1% |
| Mean | 40.1% | 11.8% |
| Median | 26.2% | 10.7% |
| Interquartile 25% (IQ1) | 21.0% | 9.1% |
| Interquartile 75% (IQ3) | 48.3% | 12.7% |
| Interquartile Range (IQR) | 27.3% | 3.6% |
| Standard Deviation (Sample) | 30.6% | 5.7% |
| Standard Deviation (Population) | 30.2% | 5.6% |
Similar Demographics by Single Male Poverty
Demographics Similar to Welsh by Single Male Poverty
In terms of single male poverty, the demographic groups most similar to Welsh are Honduran (14.0%, a difference of 0.13%), English (14.1%, a difference of 0.21%), Dutch (14.1%, a difference of 0.32%), Mexican (14.0%, a difference of 0.35%), and Immigrants from Honduras (14.1%, a difference of 0.36%).
| Demographics | Rating | Rank | Single Male Poverty |
| Immigrants | Cabo Verde | 0.1 /100 | #266 | Tragic 13.9% |
| Germans | 0.1 /100 | #267 | Tragic 13.9% |
| Immigrants | Mexico | 0.1 /100 | #268 | Tragic 13.9% |
| Scottish | 0.1 /100 | #269 | Tragic 14.0% |
| Immigrants | Saudi Arabia | 0.1 /100 | #270 | Tragic 14.0% |
| Irish | 0.1 /100 | #271 | Tragic 14.0% |
| Mexicans | 0.1 /100 | #272 | Tragic 14.0% |
| Welsh | 0.1 /100 | #273 | Tragic 14.0% |
| Hondurans | 0.1 /100 | #274 | Tragic 14.0% |
| English | 0.1 /100 | #275 | Tragic 14.1% |
| Dutch | 0.1 /100 | #276 | Tragic 14.1% |
| Immigrants | Honduras | 0.0 /100 | #277 | Tragic 14.1% |
| Slovaks | 0.0 /100 | #278 | Tragic 14.1% |
| Indonesians | 0.0 /100 | #279 | Tragic 14.1% |
| Hmong | 0.0 /100 | #280 | Tragic 14.2% |
Demographics Similar to Nepalese by Single Male Poverty
In terms of single male poverty, the demographic groups most similar to Nepalese are Immigrants from Indonesia (11.6%, a difference of 0.080%), Tlingit-Haida (11.6%, a difference of 0.10%), Immigrants from Lithuania (11.6%, a difference of 0.15%), Immigrants from Bulgaria (11.6%, a difference of 0.20%), and Paraguayan (11.6%, a difference of 0.26%).
| Demographics | Rating | Rank | Single Male Poverty |
| Immigrants | Korea | 100.0 /100 | #40 | Exceptional 11.5% |
| Immigrants | Iraq | 99.9 /100 | #41 | Exceptional 11.5% |
| Egyptians | 99.9 /100 | #42 | Exceptional 11.5% |
| Immigrants | Peru | 99.9 /100 | #43 | Exceptional 11.5% |
| Immigrants | Cameroon | 99.9 /100 | #44 | Exceptional 11.5% |
| Immigrants | Poland | 99.9 /100 | #45 | Exceptional 11.5% |
| Immigrants | Bulgaria | 99.9 /100 | #46 | Exceptional 11.6% |
| Nepalese | 99.9 /100 | #47 | Exceptional 11.6% |
| Immigrants | Indonesia | 99.9 /100 | #48 | Exceptional 11.6% |
| Tlingit-Haida | 99.9 /100 | #49 | Exceptional 11.6% |
| Immigrants | Lithuania | 99.9 /100 | #50 | Exceptional 11.6% |
| Paraguayans | 99.9 /100 | #51 | Exceptional 11.6% |
| Samoans | 99.9 /100 | #52 | Exceptional 11.7% |
| Bulgarians | 99.9 /100 | #53 | Exceptional 11.7% |
| Immigrants | Uzbekistan | 99.9 /100 | #54 | Exceptional 11.7% |