Welsh vs Immigrants from Ireland In Labor Force | Age 45-54
COMPARE
Welsh
Immigrants from Ireland
In Labor Force | Age 45-54
In Labor Force | Age 45-54 Comparison
Welsh
Immigrants from Ireland
82.3%
IN LABOR FORCE | AGE 45-54
9.2/ 100
METRIC RATING
206th/ 347
METRIC RANK
83.9%
IN LABOR FORCE | AGE 45-54
99.8/ 100
METRIC RATING
22nd/ 347
METRIC RANK
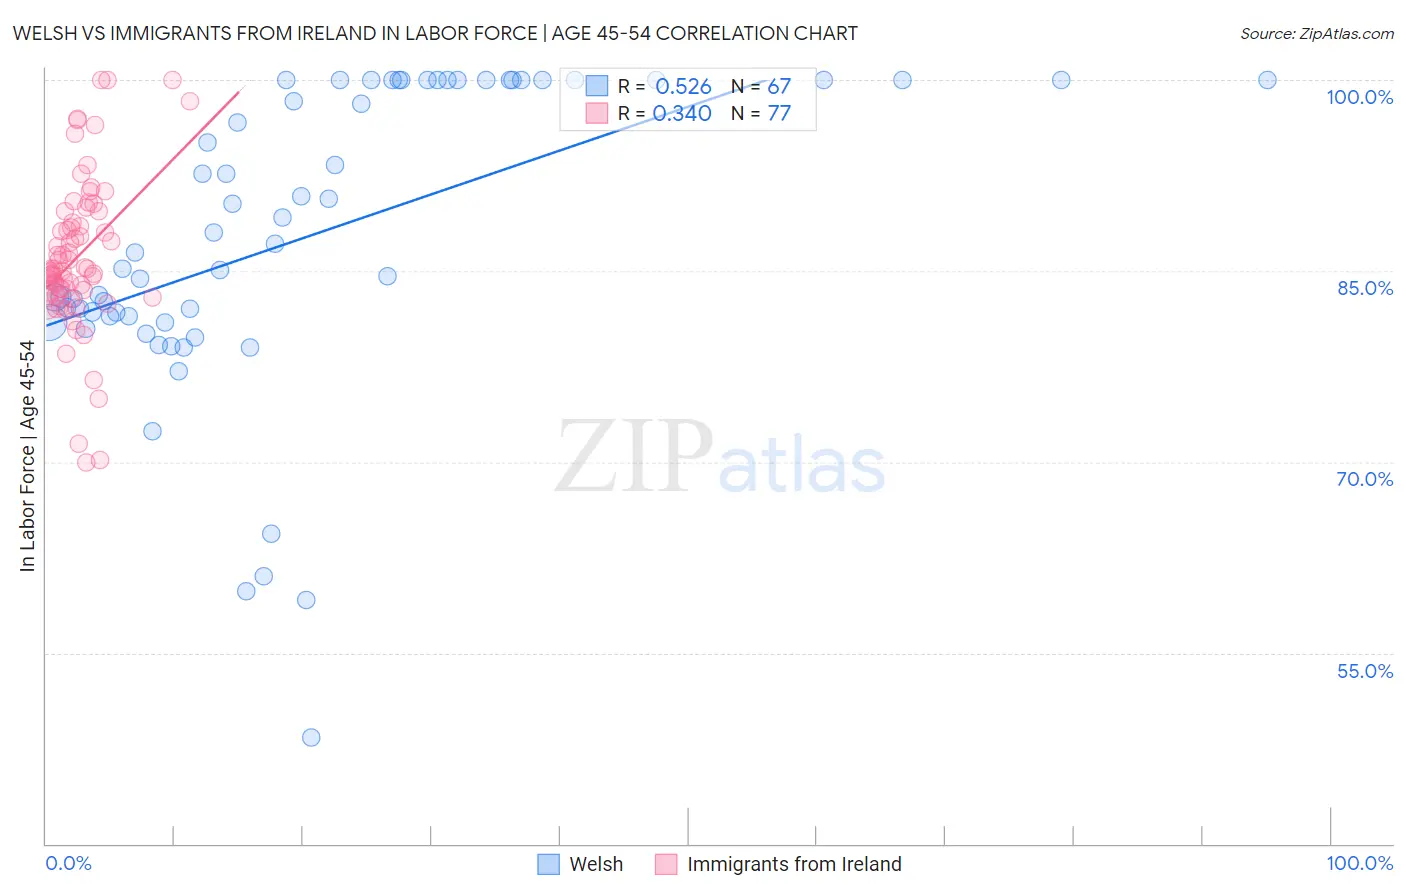
Welsh vs Immigrants from Ireland In Labor Force | Age 45-54 Correlation Chart
The statistical analysis conducted on geographies consisting of 528,109,261 people shows a substantial positive correlation between the proportion of Welsh and labor force participation rate among population between the ages 45 and 54 in the United States with a correlation coefficient (R) of 0.526 and weighted average of 82.3%. Similarly, the statistical analysis conducted on geographies consisting of 240,747,816 people shows a mild positive correlation between the proportion of Immigrants from Ireland and labor force participation rate among population between the ages 45 and 54 in the United States with a correlation coefficient (R) of 0.340 and weighted average of 83.9%, a difference of 1.9%.
In Labor Force | Age 45-54 Correlation Summary
| Measurement | Welsh | Immigrants from Ireland |
| Minimum | 48.4% | 70.0% |
| Maximum | 100.0% | 100.0% |
| Range | 51.6% | 30.0% |
| Mean | 87.7% | 86.1% |
| Median | 87.2% | 85.1% |
| Interquartile 25% (IQ1) | 81.4% | 83.2% |
| Interquartile 75% (IQ3) | 100.0% | 89.2% |
| Interquartile Range (IQR) | 18.6% | 6.0% |
| Standard Deviation (Sample) | 11.9% | 6.1% |
| Standard Deviation (Population) | 11.8% | 6.0% |
Similar Demographics by In Labor Force | Age 45-54
Demographics Similar to Welsh by In Labor Force | Age 45-54
In terms of in labor force | age 45-54, the demographic groups most similar to Welsh are Senegalese (82.4%, a difference of 0.010%), Immigrants from Cabo Verde (82.3%, a difference of 0.020%), Native Hawaiian (82.3%, a difference of 0.020%), Immigrants from Western Europe (82.4%, a difference of 0.040%), and Immigrants from Lebanon (82.3%, a difference of 0.050%).
| Demographics | Rating | Rank | In Labor Force | Age 45-54 |
| Moroccans | 15.7 /100 | #199 | Poor 82.5% |
| French Canadians | 15.4 /100 | #200 | Poor 82.5% |
| Canadians | 15.1 /100 | #201 | Poor 82.4% |
| Immigrants | Western Asia | 14.9 /100 | #202 | Poor 82.4% |
| Arabs | 11.6 /100 | #203 | Poor 82.4% |
| Immigrants | Western Europe | 10.9 /100 | #204 | Poor 82.4% |
| Senegalese | 9.5 /100 | #205 | Tragic 82.4% |
| Welsh | 9.2 /100 | #206 | Tragic 82.3% |
| Immigrants | Cabo Verde | 8.6 /100 | #207 | Tragic 82.3% |
| Native Hawaiians | 8.5 /100 | #208 | Tragic 82.3% |
| Immigrants | Lebanon | 7.4 /100 | #209 | Tragic 82.3% |
| Immigrants | Bahamas | 7.1 /100 | #210 | Tragic 82.3% |
| Immigrants | Syria | 6.6 /100 | #211 | Tragic 82.3% |
| Ecuadorians | 6.3 /100 | #212 | Tragic 82.3% |
| Immigrants | Uzbekistan | 5.8 /100 | #213 | Tragic 82.3% |
Demographics Similar to Immigrants from Ireland by In Labor Force | Age 45-54
In terms of in labor force | age 45-54, the demographic groups most similar to Immigrants from Ireland are Immigrants from Eastern Africa (83.9%, a difference of 0.0%), Immigrants from Sri Lanka (83.9%, a difference of 0.0%), Tlingit-Haida (83.9%, a difference of 0.0%), Czech (83.9%, a difference of 0.010%), and Slovene (83.9%, a difference of 0.010%).
| Demographics | Rating | Rank | In Labor Force | Age 45-54 |
| Cypriots | 99.9 /100 | #15 | Exceptional 84.1% |
| Immigrants | Nepal | 99.9 /100 | #16 | Exceptional 84.0% |
| Zimbabweans | 99.9 /100 | #17 | Exceptional 84.0% |
| Immigrants | South Central Asia | 99.9 /100 | #18 | Exceptional 84.0% |
| Czechs | 99.8 /100 | #19 | Exceptional 83.9% |
| Immigrants | Eastern Africa | 99.8 /100 | #20 | Exceptional 83.9% |
| Immigrants | Sri Lanka | 99.8 /100 | #21 | Exceptional 83.9% |
| Immigrants | Ireland | 99.8 /100 | #22 | Exceptional 83.9% |
| Tlingit-Haida | 99.8 /100 | #23 | Exceptional 83.9% |
| Slovenes | 99.8 /100 | #24 | Exceptional 83.9% |
| Immigrants | North Macedonia | 99.8 /100 | #25 | Exceptional 83.9% |
| Immigrants | Serbia | 99.8 /100 | #26 | Exceptional 83.9% |
| Immigrants | Brazil | 99.8 /100 | #27 | Exceptional 83.9% |
| Immigrants | Lithuania | 99.8 /100 | #28 | Exceptional 83.9% |
| Immigrants | Pakistan | 99.7 /100 | #29 | Exceptional 83.8% |