Welsh vs Australian Poverty
COMPARE
Welsh
Australian
Poverty
Poverty Comparison
Welsh
Australians
11.6%
POVERTY
91.6/ 100
METRIC RATING
110th/ 347
METRIC RANK
11.4%
POVERTY
94.9/ 100
METRIC RATING
95th/ 347
METRIC RANK
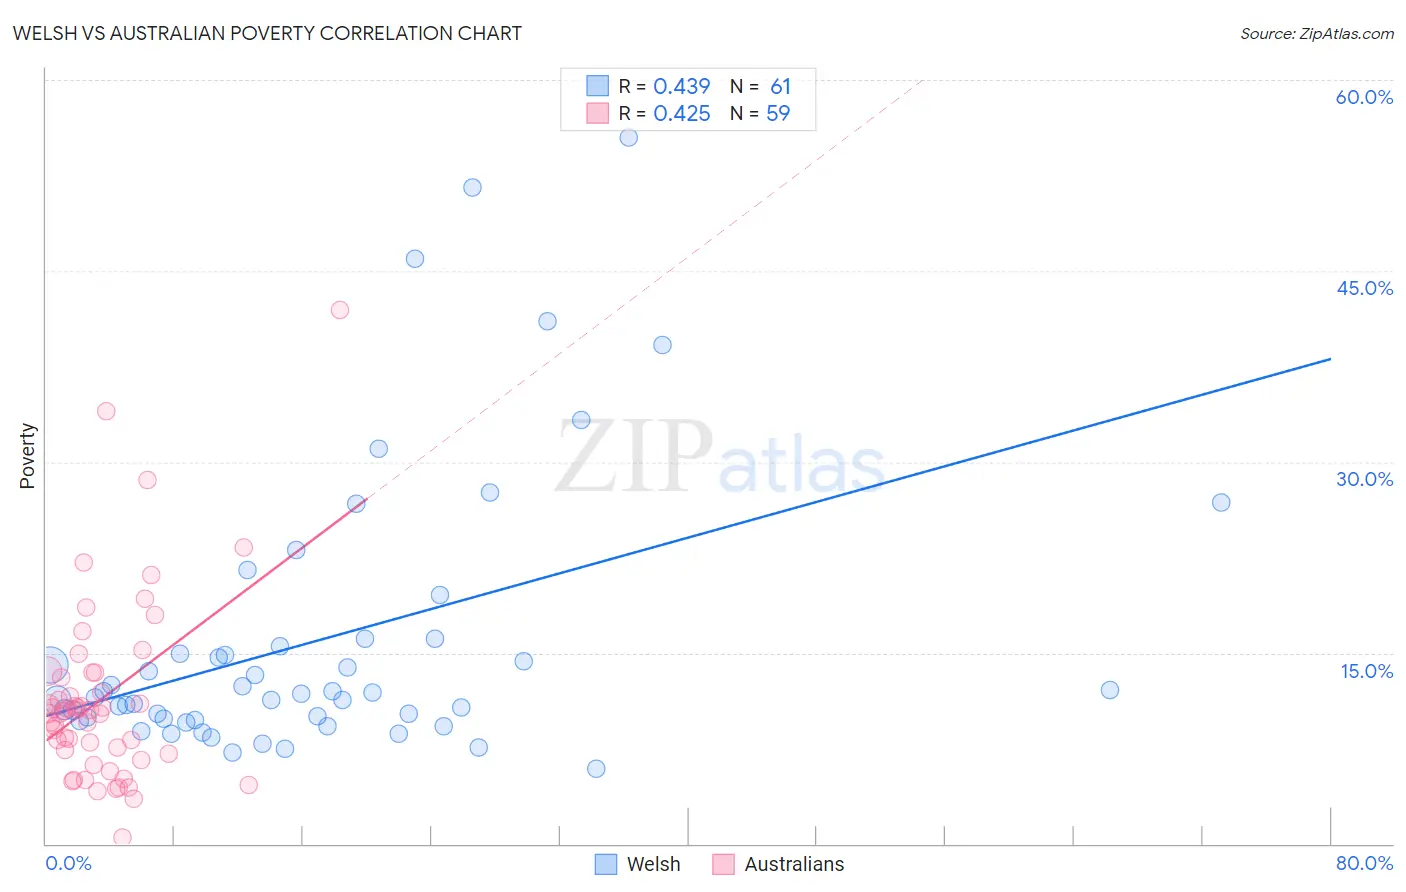
Welsh vs Australian Poverty Correlation Chart
The statistical analysis conducted on geographies consisting of 528,094,274 people shows a moderate positive correlation between the proportion of Welsh and poverty level in the United States with a correlation coefficient (R) of 0.439 and weighted average of 11.6%. Similarly, the statistical analysis conducted on geographies consisting of 224,020,538 people shows a moderate positive correlation between the proportion of Australians and poverty level in the United States with a correlation coefficient (R) of 0.425 and weighted average of 11.4%, a difference of 1.4%.
Poverty Correlation Summary
| Measurement | Welsh | Australian |
| Minimum | 5.9% | 0.47% |
| Maximum | 55.5% | 41.9% |
| Range | 49.6% | 41.4% |
| Mean | 16.0% | 11.4% |
| Median | 11.8% | 10.5% |
| Interquartile 25% (IQ1) | 9.8% | 7.0% |
| Interquartile 75% (IQ3) | 15.8% | 13.4% |
| Interquartile Range (IQR) | 6.0% | 6.4% |
| Standard Deviation (Sample) | 11.0% | 7.3% |
| Standard Deviation (Population) | 11.0% | 7.3% |
Demographics Similar to Welsh and Australians by Poverty
In terms of poverty, the demographic groups most similar to Welsh are Immigrants from Turkey (11.6%, a difference of 0.040%), Canadian (11.6%, a difference of 0.060%), Palestinian (11.6%, a difference of 0.090%), French Canadian (11.6%, a difference of 0.17%), and Portuguese (11.6%, a difference of 0.18%). Similarly, the demographic groups most similar to Australians are Paraguayan (11.4%, a difference of 0.0%), Romanian (11.4%, a difference of 0.020%), British (11.4%, a difference of 0.060%), Immigrants from South Africa (11.5%, a difference of 0.12%), and Immigrants from Egypt (11.5%, a difference of 0.15%).
| Demographics | Rating | Rank | Poverty |
| British | 95.0 /100 | #92 | Exceptional 11.4% |
| Romanians | 94.9 /100 | #93 | Exceptional 11.4% |
| Paraguayans | 94.9 /100 | #94 | Exceptional 11.4% |
| Australians | 94.9 /100 | #95 | Exceptional 11.4% |
| Immigrants | South Africa | 94.7 /100 | #96 | Exceptional 11.5% |
| Immigrants | Egypt | 94.6 /100 | #97 | Exceptional 11.5% |
| Immigrants | Latvia | 94.5 /100 | #98 | Exceptional 11.5% |
| Immigrants | Indonesia | 94.2 /100 | #99 | Exceptional 11.5% |
| Scottish | 94.0 /100 | #100 | Exceptional 11.5% |
| Slavs | 93.3 /100 | #101 | Exceptional 11.5% |
| Laotians | 92.4 /100 | #102 | Exceptional 11.6% |
| Okinawans | 92.4 /100 | #103 | Exceptional 11.6% |
| Native Hawaiians | 92.1 /100 | #104 | Exceptional 11.6% |
| Portuguese | 92.1 /100 | #105 | Exceptional 11.6% |
| Immigrants | Zimbabwe | 92.1 /100 | #106 | Exceptional 11.6% |
| Palestinians | 91.8 /100 | #107 | Exceptional 11.6% |
| Canadians | 91.7 /100 | #108 | Exceptional 11.6% |
| Immigrants | Turkey | 91.7 /100 | #109 | Exceptional 11.6% |
| Welsh | 91.6 /100 | #110 | Exceptional 11.6% |
| French Canadians | 91.0 /100 | #111 | Exceptional 11.6% |
| Immigrants | Southern Europe | 90.8 /100 | #112 | Exceptional 11.6% |