Welsh vs Burmese Poverty
COMPARE
Welsh
Burmese
Poverty
Poverty Comparison
Welsh
Burmese
11.6%
POVERTY
91.6/ 100
METRIC RATING
110th/ 347
METRIC RANK
10.7%
POVERTY
99.6/ 100
METRIC RATING
26th/ 347
METRIC RANK
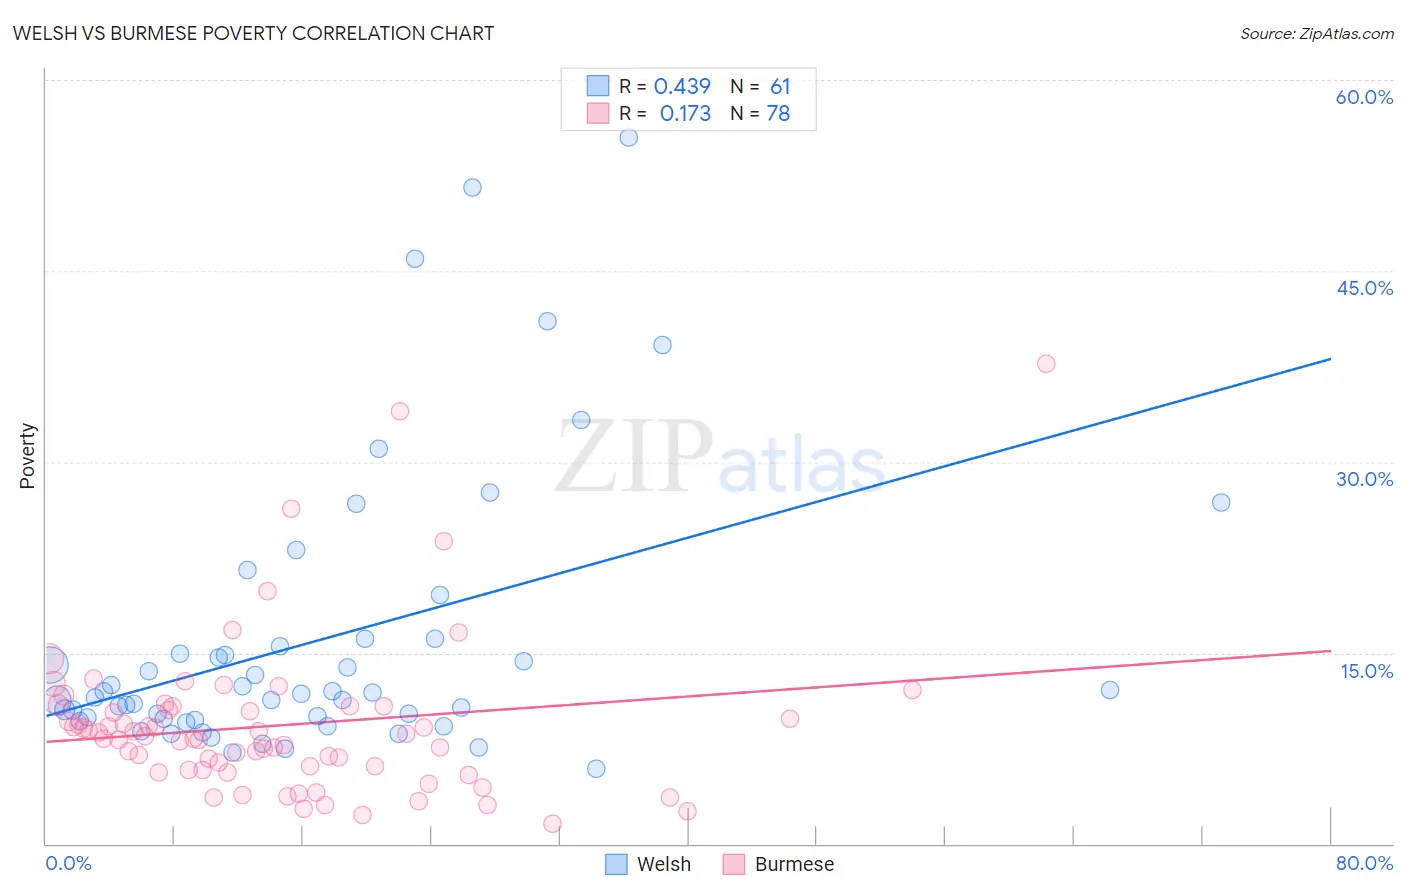
Welsh vs Burmese Poverty Correlation Chart
The statistical analysis conducted on geographies consisting of 528,094,274 people shows a moderate positive correlation between the proportion of Welsh and poverty level in the United States with a correlation coefficient (R) of 0.439 and weighted average of 11.6%. Similarly, the statistical analysis conducted on geographies consisting of 464,896,901 people shows a poor positive correlation between the proportion of Burmese and poverty level in the United States with a correlation coefficient (R) of 0.173 and weighted average of 10.7%, a difference of 8.8%.
Poverty Correlation Summary
| Measurement | Welsh | Burmese |
| Minimum | 5.9% | 1.6% |
| Maximum | 55.5% | 37.7% |
| Range | 49.6% | 36.2% |
| Mean | 16.0% | 9.3% |
| Median | 11.8% | 8.4% |
| Interquartile 25% (IQ1) | 9.8% | 5.8% |
| Interquartile 75% (IQ3) | 15.8% | 10.8% |
| Interquartile Range (IQR) | 6.0% | 4.9% |
| Standard Deviation (Sample) | 11.0% | 6.2% |
| Standard Deviation (Population) | 11.0% | 6.1% |
Similar Demographics by Poverty
Demographics Similar to Welsh by Poverty
In terms of poverty, the demographic groups most similar to Welsh are Immigrants from Turkey (11.6%, a difference of 0.040%), Canadian (11.6%, a difference of 0.060%), Palestinian (11.6%, a difference of 0.090%), French Canadian (11.6%, a difference of 0.17%), and Portuguese (11.6%, a difference of 0.18%).
| Demographics | Rating | Rank | Poverty |
| Okinawans | 92.4 /100 | #103 | Exceptional 11.6% |
| Native Hawaiians | 92.1 /100 | #104 | Exceptional 11.6% |
| Portuguese | 92.1 /100 | #105 | Exceptional 11.6% |
| Immigrants | Zimbabwe | 92.1 /100 | #106 | Exceptional 11.6% |
| Palestinians | 91.8 /100 | #107 | Exceptional 11.6% |
| Canadians | 91.7 /100 | #108 | Exceptional 11.6% |
| Immigrants | Turkey | 91.7 /100 | #109 | Exceptional 11.6% |
| Welsh | 91.6 /100 | #110 | Exceptional 11.6% |
| French Canadians | 91.0 /100 | #111 | Exceptional 11.6% |
| Immigrants | Southern Europe | 90.8 /100 | #112 | Exceptional 11.6% |
| Immigrants | Belarus | 90.8 /100 | #113 | Exceptional 11.6% |
| Immigrants | China | 90.7 /100 | #114 | Exceptional 11.6% |
| Albanians | 90.3 /100 | #115 | Exceptional 11.7% |
| Immigrants | Russia | 89.7 /100 | #116 | Excellent 11.7% |
| Sri Lankans | 89.4 /100 | #117 | Excellent 11.7% |
Demographics Similar to Burmese by Poverty
In terms of poverty, the demographic groups most similar to Burmese are Croatian (10.6%, a difference of 0.31%), Immigrants from Northern Europe (10.7%, a difference of 0.36%), Immigrants from Korea (10.7%, a difference of 0.42%), Italian (10.6%, a difference of 0.50%), and Greek (10.7%, a difference of 0.52%).
| Demographics | Rating | Rank | Poverty |
| Immigrants | Scotland | 99.7 /100 | #19 | Exceptional 10.6% |
| Immigrants | North Macedonia | 99.7 /100 | #20 | Exceptional 10.6% |
| Luxembourgers | 99.7 /100 | #21 | Exceptional 10.6% |
| Eastern Europeans | 99.7 /100 | #22 | Exceptional 10.6% |
| Swedes | 99.7 /100 | #23 | Exceptional 10.6% |
| Italians | 99.7 /100 | #24 | Exceptional 10.6% |
| Croatians | 99.6 /100 | #25 | Exceptional 10.6% |
| Burmese | 99.6 /100 | #26 | Exceptional 10.7% |
| Immigrants | Northern Europe | 99.6 /100 | #27 | Exceptional 10.7% |
| Immigrants | Korea | 99.5 /100 | #28 | Exceptional 10.7% |
| Greeks | 99.5 /100 | #29 | Exceptional 10.7% |
| Danes | 99.5 /100 | #30 | Exceptional 10.7% |
| Poles | 99.5 /100 | #31 | Exceptional 10.7% |
| Iranians | 99.5 /100 | #32 | Exceptional 10.7% |
| Macedonians | 99.4 /100 | #33 | Exceptional 10.8% |