Welsh vs Immigrants from Fiji Hearing Disability
COMPARE
Welsh
Immigrants from Fiji
Hearing Disability
Hearing Disability Comparison
Welsh
Immigrants from Fiji
3.7%
HEARING DISABILITY
0.0/ 100
METRIC RATING
295th/ 347
METRIC RANK
2.9%
HEARING DISABILITY
67.1/ 100
METRIC RATING
160th/ 347
METRIC RANK
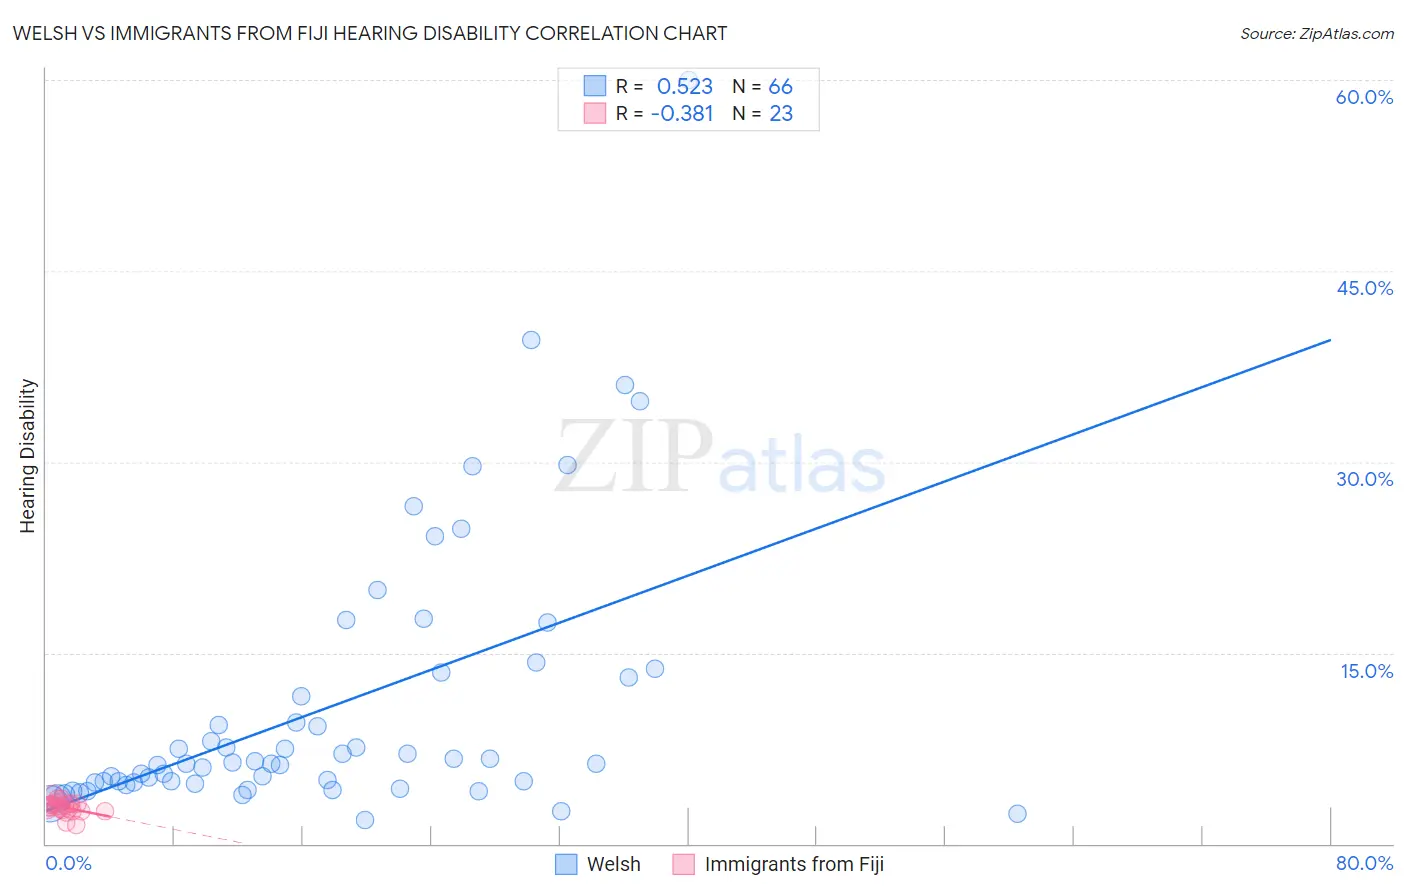
Welsh vs Immigrants from Fiji Hearing Disability Correlation Chart
The statistical analysis conducted on geographies consisting of 528,244,925 people shows a substantial positive correlation between the proportion of Welsh and percentage of population with hearing disability in the United States with a correlation coefficient (R) of 0.523 and weighted average of 3.7%. Similarly, the statistical analysis conducted on geographies consisting of 93,738,910 people shows a mild negative correlation between the proportion of Immigrants from Fiji and percentage of population with hearing disability in the United States with a correlation coefficient (R) of -0.381 and weighted average of 2.9%, a difference of 25.9%.
Hearing Disability Correlation Summary
| Measurement | Welsh | Immigrants from Fiji |
| Minimum | 1.9% | 1.4% |
| Maximum | 60.0% | 3.9% |
| Range | 58.1% | 2.5% |
| Mean | 10.7% | 2.9% |
| Median | 6.3% | 2.9% |
| Interquartile 25% (IQ1) | 4.8% | 2.5% |
| Interquartile 75% (IQ3) | 13.0% | 3.2% |
| Interquartile Range (IQR) | 8.2% | 0.61% |
| Standard Deviation (Sample) | 10.8% | 0.54% |
| Standard Deviation (Population) | 10.7% | 0.53% |
Similar Demographics by Hearing Disability
Demographics Similar to Welsh by Hearing Disability
In terms of hearing disability, the demographic groups most similar to Welsh are Pima (3.7%, a difference of 0.13%), Immigrants from the Azores (3.7%, a difference of 0.20%), Iroquois (3.7%, a difference of 0.27%), Celtic (3.7%, a difference of 0.39%), and Norwegian (3.7%, a difference of 0.51%).
| Demographics | Rating | Rank | Hearing Disability |
| Irish | 0.0 /100 | #288 | Tragic 3.7% |
| Chinese | 0.0 /100 | #289 | Tragic 3.7% |
| Whites/Caucasians | 0.0 /100 | #290 | Tragic 3.7% |
| Finns | 0.0 /100 | #291 | Tragic 3.7% |
| Native Hawaiians | 0.0 /100 | #292 | Tragic 3.7% |
| Norwegians | 0.0 /100 | #293 | Tragic 3.7% |
| Iroquois | 0.0 /100 | #294 | Tragic 3.7% |
| Welsh | 0.0 /100 | #295 | Tragic 3.7% |
| Pima | 0.0 /100 | #296 | Tragic 3.7% |
| Immigrants | Azores | 0.0 /100 | #297 | Tragic 3.7% |
| Celtics | 0.0 /100 | #298 | Tragic 3.7% |
| Germans | 0.0 /100 | #299 | Tragic 3.7% |
| Scottish | 0.0 /100 | #300 | Tragic 3.7% |
| Pennsylvania Germans | 0.0 /100 | #301 | Tragic 3.7% |
| Dutch | 0.0 /100 | #302 | Tragic 3.7% |
Demographics Similar to Immigrants from Fiji by Hearing Disability
In terms of hearing disability, the demographic groups most similar to Immigrants from Fiji are Immigrants from Australia (2.9%, a difference of 0.020%), Albanian (2.9%, a difference of 0.060%), Immigrants from Japan (2.9%, a difference of 0.090%), Immigrants from Central America (3.0%, a difference of 0.24%), and Immigrants from Cambodia (3.0%, a difference of 0.25%).
| Demographics | Rating | Rank | Hearing Disability |
| Sudanese | 72.1 /100 | #153 | Good 2.9% |
| Immigrants | Lebanon | 71.5 /100 | #154 | Good 2.9% |
| Costa Ricans | 71.4 /100 | #155 | Good 2.9% |
| Immigrants | Poland | 70.2 /100 | #156 | Good 2.9% |
| Immigrants | Kazakhstan | 69.6 /100 | #157 | Good 2.9% |
| Immigrants | Burma/Myanmar | 69.5 /100 | #158 | Good 2.9% |
| Immigrants | Australia | 67.4 /100 | #159 | Good 2.9% |
| Immigrants | Fiji | 67.1 /100 | #160 | Good 2.9% |
| Albanians | 66.6 /100 | #161 | Good 2.9% |
| Immigrants | Japan | 66.3 /100 | #162 | Good 2.9% |
| Immigrants | Central America | 64.9 /100 | #163 | Good 3.0% |
| Immigrants | Cambodia | 64.8 /100 | #164 | Good 3.0% |
| Immigrants | Zimbabwe | 64.2 /100 | #165 | Good 3.0% |
| Immigrants | South Eastern Asia | 62.9 /100 | #166 | Good 3.0% |
| Immigrants | Eastern Europe | 58.1 /100 | #167 | Average 3.0% |