Welsh vs Immigrants from Fiji Kindergarten
COMPARE
Welsh
Immigrants from Fiji
Kindergarten
Kindergarten Comparison
Welsh
Immigrants from Fiji
98.9%
KINDERGARTEN
100.0/ 100
METRIC RATING
4th/ 347
METRIC RANK
96.5%
KINDERGARTEN
0.0/ 100
METRIC RATING
338th/ 347
METRIC RANK
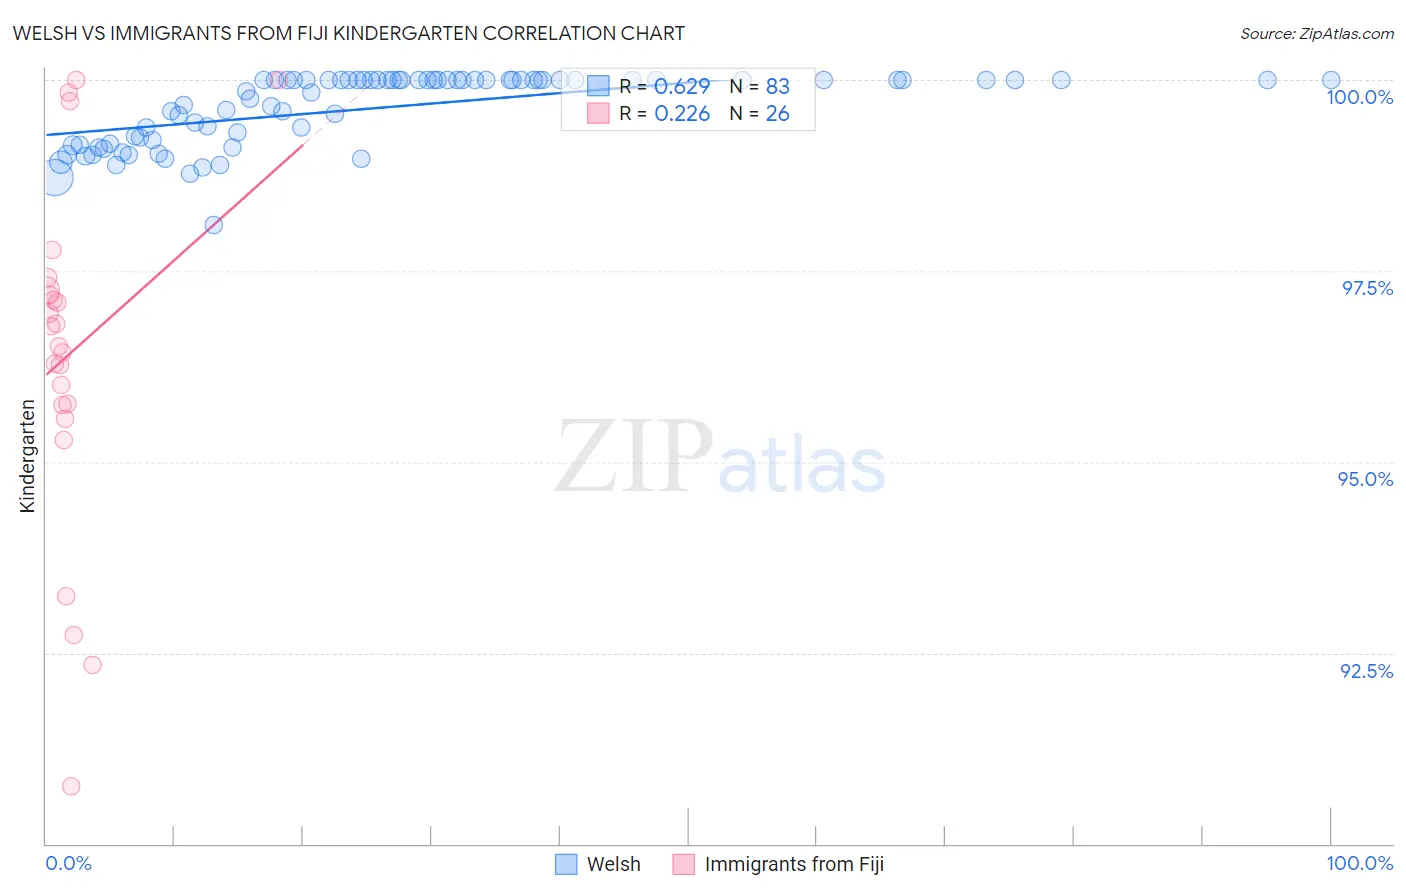
Welsh vs Immigrants from Fiji Kindergarten Correlation Chart
The statistical analysis conducted on geographies consisting of 239,962,401 people shows a significant positive correlation between the proportion of Welsh and percentage of population with at least kindergarten education in the United States with a correlation coefficient (R) of 0.629 and weighted average of 98.9%. Similarly, the statistical analysis conducted on geographies consisting of 93,756,204 people shows a weak positive correlation between the proportion of Immigrants from Fiji and percentage of population with at least kindergarten education in the United States with a correlation coefficient (R) of 0.226 and weighted average of 96.5%, a difference of 2.5%.
Kindergarten Correlation Summary
| Measurement | Welsh | Immigrants from Fiji |
| Minimum | 98.1% | 90.8% |
| Maximum | 100.0% | 100.0% |
| Range | 1.9% | 9.2% |
| Mean | 99.6% | 96.4% |
| Median | 100.0% | 96.6% |
| Interquartile 25% (IQ1) | 99.2% | 95.7% |
| Interquartile 75% (IQ3) | 100.0% | 97.2% |
| Interquartile Range (IQR) | 0.84% | 1.5% |
| Standard Deviation (Sample) | 0.46% | 2.3% |
| Standard Deviation (Population) | 0.46% | 2.2% |
Similar Demographics by Kindergarten
Demographics Similar to Welsh by Kindergarten
In terms of kindergarten, the demographic groups most similar to Welsh are Inupiat (98.9%, a difference of 0.010%), Tsimshian (98.8%, a difference of 0.020%), Alaskan Athabascan (98.8%, a difference of 0.090%), Alaska Native (98.7%, a difference of 0.13%), and Norwegian (98.7%, a difference of 0.15%).
| Demographics | Rating | Rank | Kindergarten |
| Crow | 100.0 /100 | #1 | Exceptional 99.7% |
| Yup'ik | 100.0 /100 | #2 | Exceptional 99.2% |
| Inupiat | 100.0 /100 | #3 | Exceptional 98.9% |
| Welsh | 100.0 /100 | #4 | Exceptional 98.9% |
| Tsimshian | 100.0 /100 | #5 | Exceptional 98.8% |
| Alaskan Athabascans | 100.0 /100 | #6 | Exceptional 98.8% |
| Alaska Natives | 100.0 /100 | #7 | Exceptional 98.7% |
| Norwegians | 100.0 /100 | #8 | Exceptional 98.7% |
| Tlingit-Haida | 100.0 /100 | #9 | Exceptional 98.7% |
| Slovaks | 100.0 /100 | #10 | Exceptional 98.7% |
| Germans | 100.0 /100 | #11 | Exceptional 98.7% |
| Slovenes | 100.0 /100 | #12 | Exceptional 98.7% |
| Carpatho Rusyns | 100.0 /100 | #13 | Exceptional 98.7% |
| English | 100.0 /100 | #14 | Exceptional 98.7% |
| Swedes | 100.0 /100 | #15 | Exceptional 98.7% |
Demographics Similar to Immigrants from Fiji by Kindergarten
In terms of kindergarten, the demographic groups most similar to Immigrants from Fiji are Immigrants from Cambodia (96.5%, a difference of 0.010%), Guatemalan (96.5%, a difference of 0.050%), Immigrants from Dominican Republic (96.6%, a difference of 0.080%), Bangladeshi (96.6%, a difference of 0.080%), and Immigrants from Guatemala (96.4%, a difference of 0.080%).
| Demographics | Rating | Rank | Kindergarten |
| Immigrants | Armenia | 0.0 /100 | #331 | Tragic 96.6% |
| Yakama | 0.0 /100 | #332 | Tragic 96.6% |
| Central Americans | 0.0 /100 | #333 | Tragic 96.6% |
| Immigrants | Dominican Republic | 0.0 /100 | #334 | Tragic 96.6% |
| Bangladeshis | 0.0 /100 | #335 | Tragic 96.6% |
| Guatemalans | 0.0 /100 | #336 | Tragic 96.5% |
| Immigrants | Cambodia | 0.0 /100 | #337 | Tragic 96.5% |
| Immigrants | Fiji | 0.0 /100 | #338 | Tragic 96.5% |
| Immigrants | Guatemala | 0.0 /100 | #339 | Tragic 96.4% |
| Immigrants | Central America | 0.0 /100 | #340 | Tragic 96.4% |
| Immigrants | Cabo Verde | 0.0 /100 | #341 | Tragic 96.4% |
| Immigrants | Mexico | 0.0 /100 | #342 | Tragic 96.4% |
| Salvadorans | 0.0 /100 | #343 | Tragic 96.3% |
| Nepalese | 0.0 /100 | #344 | Tragic 96.2% |
| Immigrants | El Salvador | 0.0 /100 | #345 | Tragic 96.2% |