Welsh vs Immigrants from Fiji 5th Grade
COMPARE
Welsh
Immigrants from Fiji
5th Grade
5th Grade Comparison
Welsh
Immigrants from Fiji
98.6%
5TH GRADE
100.0/ 100
METRIC RATING
2nd/ 347
METRIC RANK
95.6%
5TH GRADE
0.0/ 100
METRIC RATING
323rd/ 347
METRIC RANK
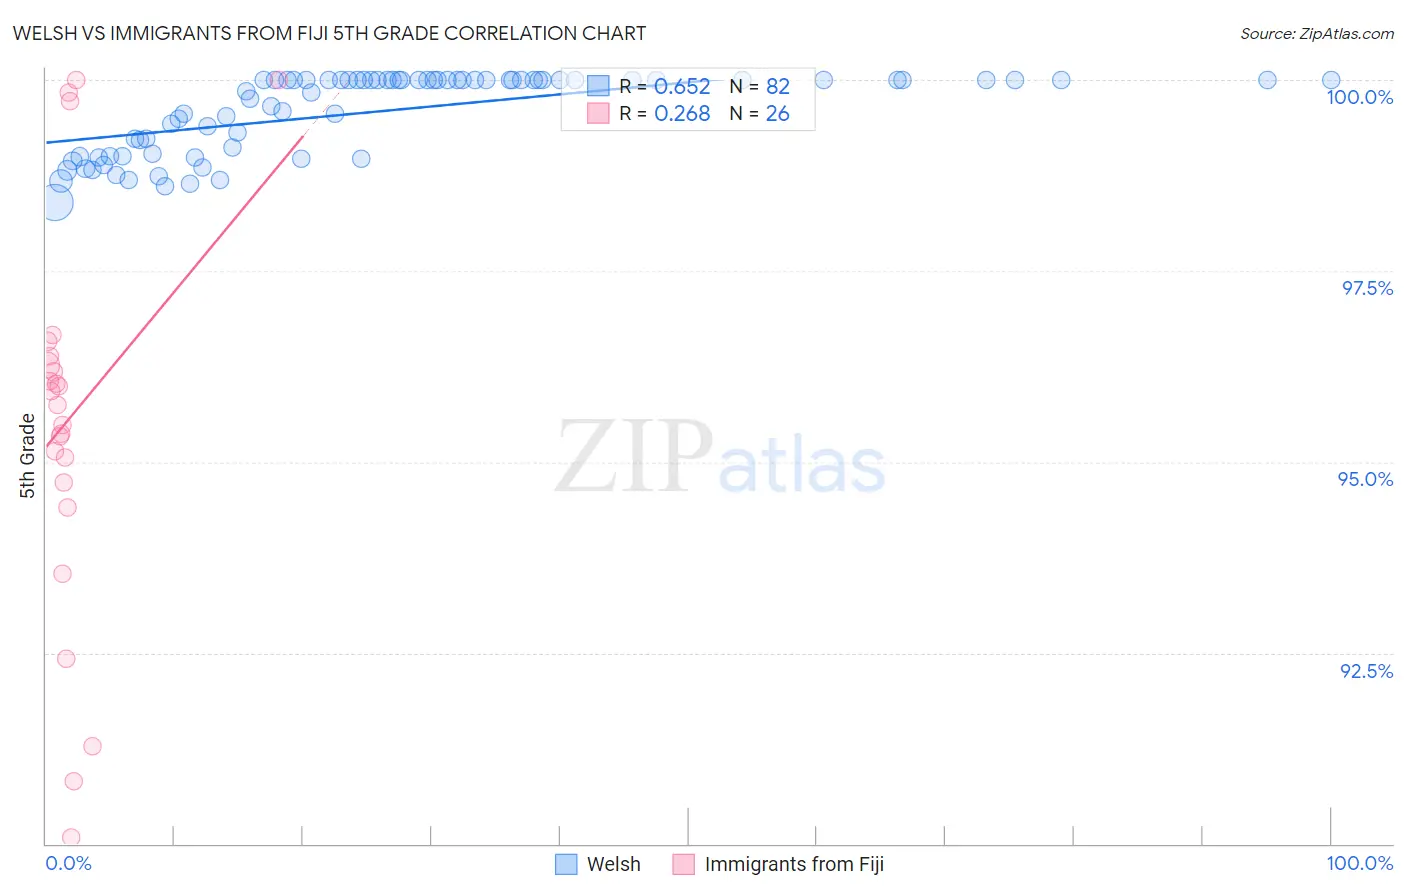
Welsh vs Immigrants from Fiji 5th Grade Correlation Chart
The statistical analysis conducted on geographies consisting of 239,959,962 people shows a significant positive correlation between the proportion of Welsh and percentage of population with at least 5th grade education in the United States with a correlation coefficient (R) of 0.652 and weighted average of 98.6%. Similarly, the statistical analysis conducted on geographies consisting of 93,756,204 people shows a weak positive correlation between the proportion of Immigrants from Fiji and percentage of population with at least 5th grade education in the United States with a correlation coefficient (R) of 0.268 and weighted average of 95.6%, a difference of 3.2%.
5th Grade Correlation Summary
| Measurement | Welsh | Immigrants from Fiji |
| Minimum | 98.4% | 90.1% |
| Maximum | 100.0% | 100.0% |
| Range | 1.6% | 9.9% |
| Mean | 99.6% | 95.6% |
| Median | 100.0% | 95.8% |
| Interquartile 25% (IQ1) | 99.0% | 94.7% |
| Interquartile 75% (IQ3) | 100.0% | 96.4% |
| Interquartile Range (IQR) | 0.99% | 1.6% |
| Standard Deviation (Sample) | 0.52% | 2.6% |
| Standard Deviation (Population) | 0.51% | 2.5% |
Similar Demographics by 5th Grade
Demographics Similar to Welsh by 5th Grade
In terms of 5th grade, the demographic groups most similar to Welsh are Norwegian (98.4%, a difference of 0.20%), Tsimshian (98.4%, a difference of 0.20%), Slovak (98.4%, a difference of 0.22%), German (98.4%, a difference of 0.22%), and Inupiat (98.4%, a difference of 0.25%).
| Demographics | Rating | Rank | 5th Grade |
| Crow | 100.0 /100 | #1 | Exceptional 99.5% |
| Welsh | 100.0 /100 | #2 | Exceptional 98.6% |
| Norwegians | 100.0 /100 | #3 | Exceptional 98.4% |
| Tsimshian | 100.0 /100 | #4 | Exceptional 98.4% |
| Slovaks | 100.0 /100 | #5 | Exceptional 98.4% |
| Germans | 100.0 /100 | #6 | Exceptional 98.4% |
| Inupiat | 100.0 /100 | #7 | Exceptional 98.4% |
| Slovenes | 100.0 /100 | #8 | Exceptional 98.3% |
| Swedes | 100.0 /100 | #9 | Exceptional 98.3% |
| English | 100.0 /100 | #10 | Exceptional 98.3% |
| Alaskan Athabascans | 100.0 /100 | #11 | Exceptional 98.3% |
| Carpatho Rusyns | 100.0 /100 | #12 | Exceptional 98.3% |
| Tlingit-Haida | 100.0 /100 | #13 | Exceptional 98.3% |
| Dutch | 100.0 /100 | #14 | Exceptional 98.3% |
| Scottish | 100.0 /100 | #15 | Exceptional 98.3% |
Demographics Similar to Immigrants from Fiji by 5th Grade
In terms of 5th grade, the demographic groups most similar to Immigrants from Fiji are Honduran (95.6%, a difference of 0.020%), Hispanic or Latino (95.6%, a difference of 0.020%), Immigrants from Nicaragua (95.6%, a difference of 0.050%), Immigrants from Cambodia (95.5%, a difference of 0.050%), and Dominican (95.5%, a difference of 0.050%).
| Demographics | Rating | Rank | 5th Grade |
| Immigrants | Ecuador | 0.0 /100 | #316 | Tragic 95.8% |
| Belizeans | 0.0 /100 | #317 | Tragic 95.8% |
| Immigrants | Vietnam | 0.0 /100 | #318 | Tragic 95.8% |
| Japanese | 0.0 /100 | #319 | Tragic 95.7% |
| Central American Indians | 0.0 /100 | #320 | Tragic 95.7% |
| Immigrants | Belize | 0.0 /100 | #321 | Tragic 95.7% |
| Immigrants | Nicaragua | 0.0 /100 | #322 | Tragic 95.6% |
| Immigrants | Fiji | 0.0 /100 | #323 | Tragic 95.6% |
| Hondurans | 0.0 /100 | #324 | Tragic 95.6% |
| Hispanics or Latinos | 0.0 /100 | #325 | Tragic 95.6% |
| Immigrants | Cambodia | 0.0 /100 | #326 | Tragic 95.5% |
| Dominicans | 0.0 /100 | #327 | Tragic 95.5% |
| Cape Verdeans | 0.0 /100 | #328 | Tragic 95.5% |
| Mexican American Indians | 0.0 /100 | #329 | Tragic 95.5% |
| Immigrants | Armenia | 0.0 /100 | #330 | Tragic 95.4% |