Venezuelan vs Central American Indian Single Female Poverty
COMPARE
Venezuelan
Central American Indian
Single Female Poverty
Single Female Poverty Comparison
Venezuelans
Central American Indians
20.4%
SINGLE FEMALE POVERTY
85.5/ 100
METRIC RATING
146th/ 347
METRIC RANK
25.5%
SINGLE FEMALE POVERTY
0.0/ 100
METRIC RATING
310th/ 347
METRIC RANK
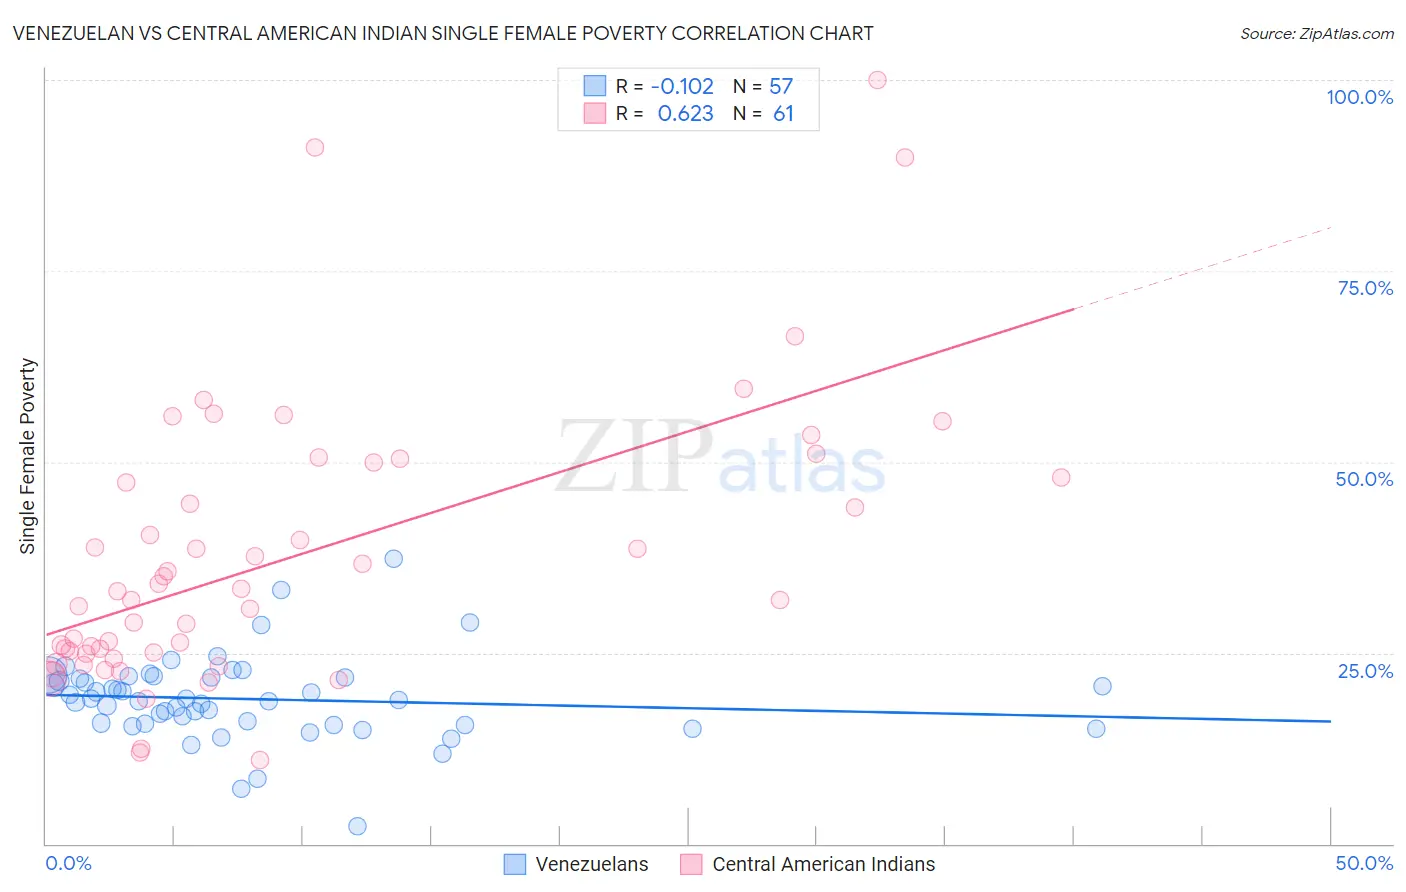
Venezuelan vs Central American Indian Single Female Poverty Correlation Chart
The statistical analysis conducted on geographies consisting of 303,310,735 people shows a poor negative correlation between the proportion of Venezuelans and poverty level among single females in the United States with a correlation coefficient (R) of -0.102 and weighted average of 20.4%. Similarly, the statistical analysis conducted on geographies consisting of 323,666,158 people shows a significant positive correlation between the proportion of Central American Indians and poverty level among single females in the United States with a correlation coefficient (R) of 0.623 and weighted average of 25.5%, a difference of 24.6%.
Single Female Poverty Correlation Summary
| Measurement | Venezuelan | Central American Indian |
| Minimum | 2.3% | 11.0% |
| Maximum | 37.3% | 100.0% |
| Range | 35.0% | 89.0% |
| Mean | 18.9% | 37.6% |
| Median | 18.8% | 33.1% |
| Interquartile 25% (IQ1) | 15.6% | 24.9% |
| Interquartile 75% (IQ3) | 21.8% | 49.0% |
| Interquartile Range (IQR) | 6.2% | 24.0% |
| Standard Deviation (Sample) | 5.6% | 18.3% |
| Standard Deviation (Population) | 5.5% | 18.2% |
Similar Demographics by Single Female Poverty
Demographics Similar to Venezuelans by Single Female Poverty
In terms of single female poverty, the demographic groups most similar to Venezuelans are Austrian (20.4%, a difference of 0.030%), South African (20.4%, a difference of 0.030%), Luxembourger (20.4%, a difference of 0.080%), Immigrants from Uzbekistan (20.3%, a difference of 0.39%), and Australian (20.3%, a difference of 0.40%).
| Demographics | Rating | Rank | Single Female Poverty |
| Immigrants | Kuwait | 90.4 /100 | #139 | Exceptional 20.3% |
| Syrians | 90.4 /100 | #140 | Exceptional 20.3% |
| Immigrants | North America | 89.5 /100 | #141 | Excellent 20.3% |
| Immigrants | Uganda | 89.1 /100 | #142 | Excellent 20.3% |
| Australians | 88.4 /100 | #143 | Excellent 20.3% |
| Immigrants | Uzbekistan | 88.3 /100 | #144 | Excellent 20.3% |
| Austrians | 85.8 /100 | #145 | Excellent 20.4% |
| Venezuelans | 85.5 /100 | #146 | Excellent 20.4% |
| South Africans | 85.3 /100 | #147 | Excellent 20.4% |
| Luxembourgers | 84.9 /100 | #148 | Excellent 20.4% |
| Portuguese | 81.5 /100 | #149 | Excellent 20.5% |
| Immigrants | Denmark | 80.5 /100 | #150 | Excellent 20.5% |
| Puget Sound Salish | 79.6 /100 | #151 | Good 20.6% |
| Immigrants | Uruguay | 77.7 /100 | #152 | Good 20.6% |
| Swedes | 77.1 /100 | #153 | Good 20.6% |
Demographics Similar to Central American Indians by Single Female Poverty
In terms of single female poverty, the demographic groups most similar to Central American Indians are Dominican (25.4%, a difference of 0.15%), Aleut (25.4%, a difference of 0.16%), Immigrants from Honduras (25.5%, a difference of 0.28%), Potawatomi (25.4%, a difference of 0.33%), and Paiute (25.5%, a difference of 0.33%).
| Demographics | Rating | Rank | Single Female Poverty |
| Somalis | 0.0 /100 | #303 | Tragic 25.2% |
| Immigrants | Congo | 0.0 /100 | #304 | Tragic 25.3% |
| Immigrants | Dominican Republic | 0.0 /100 | #305 | Tragic 25.3% |
| Immigrants | Mexico | 0.0 /100 | #306 | Tragic 25.3% |
| Potawatomi | 0.0 /100 | #307 | Tragic 25.4% |
| Aleuts | 0.0 /100 | #308 | Tragic 25.4% |
| Dominicans | 0.0 /100 | #309 | Tragic 25.4% |
| Central American Indians | 0.0 /100 | #310 | Tragic 25.5% |
| Immigrants | Honduras | 0.0 /100 | #311 | Tragic 25.5% |
| Paiute | 0.0 /100 | #312 | Tragic 25.5% |
| Comanche | 0.0 /100 | #313 | Tragic 25.6% |
| Cherokee | 0.0 /100 | #314 | Tragic 25.7% |
| Iroquois | 0.0 /100 | #315 | Tragic 25.7% |
| Immigrants | Somalia | 0.0 /100 | #316 | Tragic 25.8% |
| Ottawa | 0.0 /100 | #317 | Tragic 26.0% |