Venezuelan vs Immigrants from Laos Single Female Poverty
COMPARE
Venezuelan
Immigrants from Laos
Single Female Poverty
Single Female Poverty Comparison
Venezuelans
Immigrants from Laos
20.4%
SINGLE FEMALE POVERTY
85.5/ 100
METRIC RATING
146th/ 347
METRIC RANK
22.9%
SINGLE FEMALE POVERTY
0.3/ 100
METRIC RATING
264th/ 347
METRIC RANK
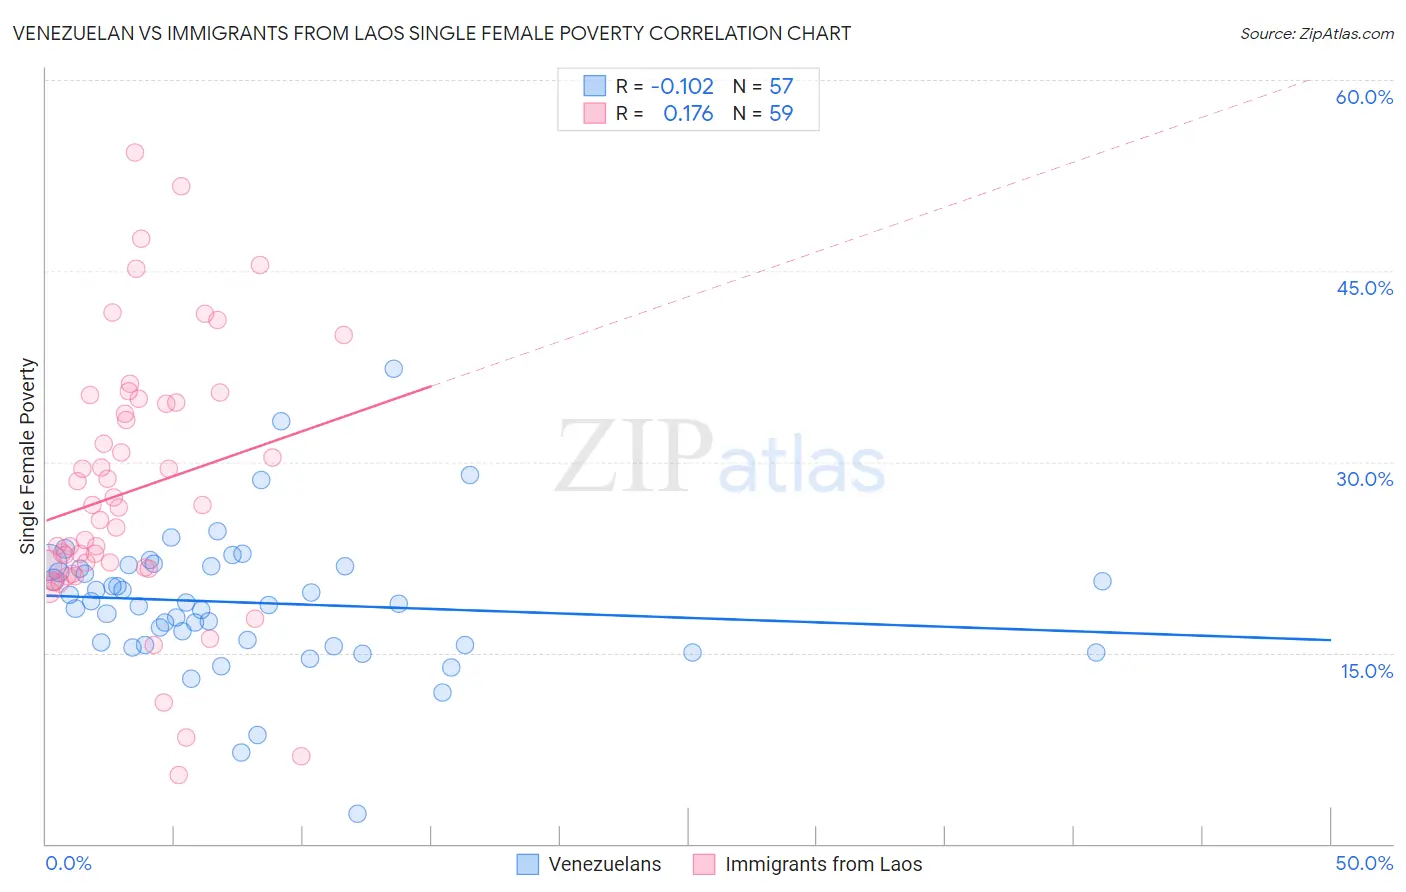
Venezuelan vs Immigrants from Laos Single Female Poverty Correlation Chart
The statistical analysis conducted on geographies consisting of 303,310,735 people shows a poor negative correlation between the proportion of Venezuelans and poverty level among single females in the United States with a correlation coefficient (R) of -0.102 and weighted average of 20.4%. Similarly, the statistical analysis conducted on geographies consisting of 200,096,236 people shows a poor positive correlation between the proportion of Immigrants from Laos and poverty level among single females in the United States with a correlation coefficient (R) of 0.176 and weighted average of 22.9%, a difference of 12.3%.
Single Female Poverty Correlation Summary
| Measurement | Venezuelan | Immigrants from Laos |
| Minimum | 2.3% | 5.4% |
| Maximum | 37.3% | 54.3% |
| Range | 35.0% | 48.9% |
| Mean | 18.9% | 27.8% |
| Median | 18.8% | 26.4% |
| Interquartile 25% (IQ1) | 15.6% | 21.6% |
| Interquartile 75% (IQ3) | 21.8% | 34.7% |
| Interquartile Range (IQR) | 6.2% | 13.1% |
| Standard Deviation (Sample) | 5.6% | 10.3% |
| Standard Deviation (Population) | 5.5% | 10.2% |
Similar Demographics by Single Female Poverty
Demographics Similar to Venezuelans by Single Female Poverty
In terms of single female poverty, the demographic groups most similar to Venezuelans are Austrian (20.4%, a difference of 0.030%), South African (20.4%, a difference of 0.030%), Luxembourger (20.4%, a difference of 0.080%), Immigrants from Uzbekistan (20.3%, a difference of 0.39%), and Australian (20.3%, a difference of 0.40%).
| Demographics | Rating | Rank | Single Female Poverty |
| Immigrants | Kuwait | 90.4 /100 | #139 | Exceptional 20.3% |
| Syrians | 90.4 /100 | #140 | Exceptional 20.3% |
| Immigrants | North America | 89.5 /100 | #141 | Excellent 20.3% |
| Immigrants | Uganda | 89.1 /100 | #142 | Excellent 20.3% |
| Australians | 88.4 /100 | #143 | Excellent 20.3% |
| Immigrants | Uzbekistan | 88.3 /100 | #144 | Excellent 20.3% |
| Austrians | 85.8 /100 | #145 | Excellent 20.4% |
| Venezuelans | 85.5 /100 | #146 | Excellent 20.4% |
| South Africans | 85.3 /100 | #147 | Excellent 20.4% |
| Luxembourgers | 84.9 /100 | #148 | Excellent 20.4% |
| Portuguese | 81.5 /100 | #149 | Excellent 20.5% |
| Immigrants | Denmark | 80.5 /100 | #150 | Excellent 20.5% |
| Puget Sound Salish | 79.6 /100 | #151 | Good 20.6% |
| Immigrants | Uruguay | 77.7 /100 | #152 | Good 20.6% |
| Swedes | 77.1 /100 | #153 | Good 20.6% |
Demographics Similar to Immigrants from Laos by Single Female Poverty
In terms of single female poverty, the demographic groups most similar to Immigrants from Laos are Scotch-Irish (22.9%, a difference of 0.070%), Central American (23.0%, a difference of 0.17%), Immigrants from Micronesia (23.0%, a difference of 0.38%), Senegalese (23.0%, a difference of 0.44%), and British West Indian (22.8%, a difference of 0.48%).
| Demographics | Rating | Rank | Single Female Poverty |
| Sudanese | 0.7 /100 | #257 | Tragic 22.6% |
| Bahamians | 0.6 /100 | #258 | Tragic 22.7% |
| Whites/Caucasians | 0.6 /100 | #259 | Tragic 22.7% |
| Celtics | 0.5 /100 | #260 | Tragic 22.7% |
| Immigrants | Cabo Verde | 0.4 /100 | #261 | Tragic 22.8% |
| British West Indians | 0.4 /100 | #262 | Tragic 22.8% |
| Scotch-Irish | 0.3 /100 | #263 | Tragic 22.9% |
| Immigrants | Laos | 0.3 /100 | #264 | Tragic 22.9% |
| Central Americans | 0.2 /100 | #265 | Tragic 23.0% |
| Immigrants | Micronesia | 0.2 /100 | #266 | Tragic 23.0% |
| Senegalese | 0.2 /100 | #267 | Tragic 23.0% |
| Fijians | 0.2 /100 | #268 | Tragic 23.1% |
| Hmong | 0.2 /100 | #269 | Tragic 23.1% |
| Inupiat | 0.2 /100 | #270 | Tragic 23.1% |
| Sub-Saharan Africans | 0.1 /100 | #271 | Tragic 23.2% |