Venezuelan vs Central American Indian Single Father Households
COMPARE
Venezuelan
Central American Indian
Single Father Households
Single Father Households Comparison
Venezuelans
Central American Indians
2.3%
SINGLE FATHER HOUSEHOLDS
86.2/ 100
METRIC RATING
150th/ 347
METRIC RANK
2.7%
SINGLE FATHER HOUSEHOLDS
0.0/ 100
METRIC RATING
287th/ 347
METRIC RANK
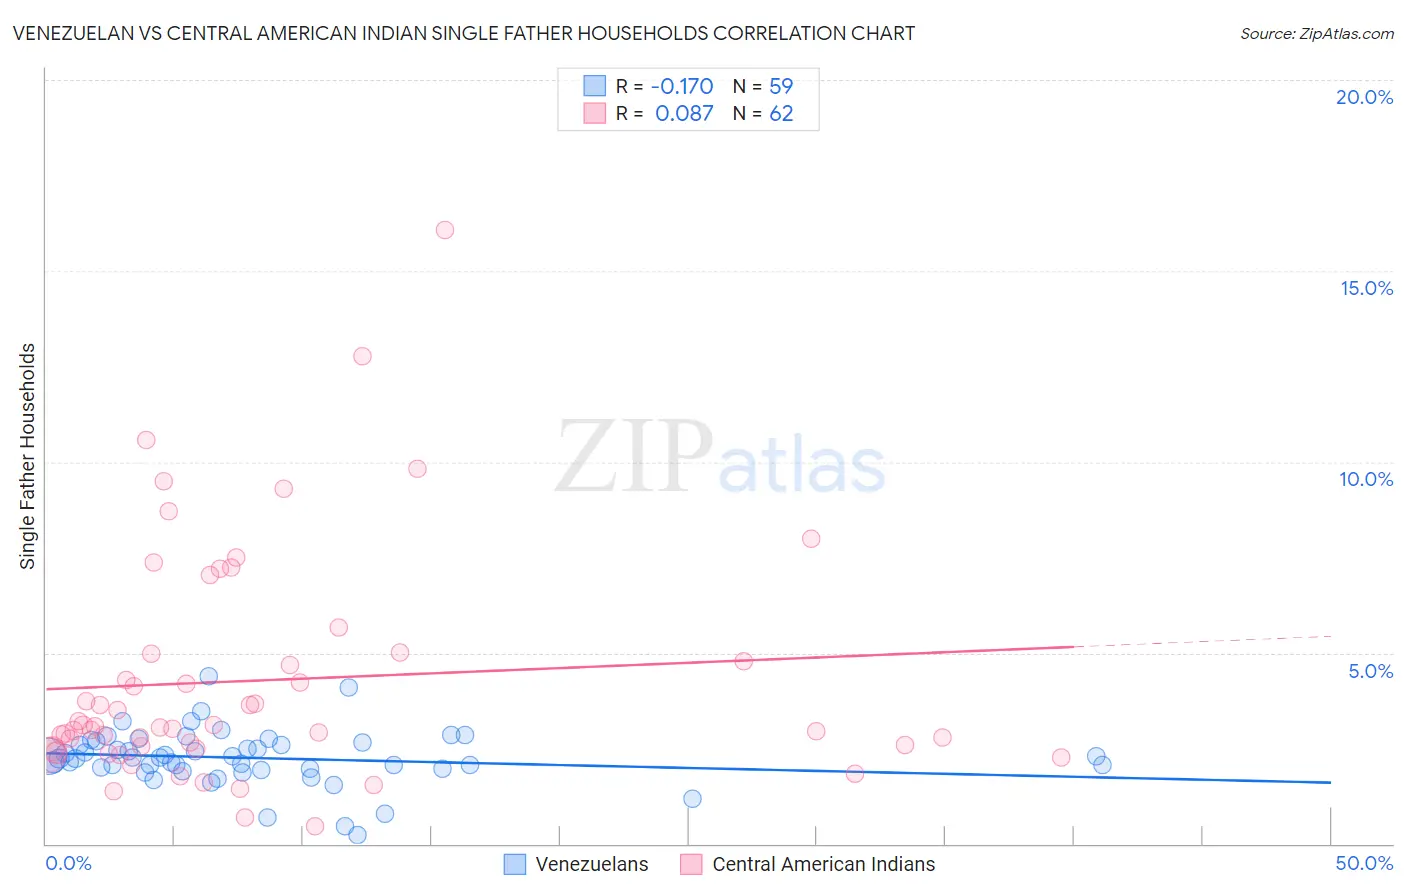
Venezuelan vs Central American Indian Single Father Households Correlation Chart
The statistical analysis conducted on geographies consisting of 304,547,521 people shows a poor negative correlation between the proportion of Venezuelans and percentage of single father households in the United States with a correlation coefficient (R) of -0.170 and weighted average of 2.3%. Similarly, the statistical analysis conducted on geographies consisting of 324,676,108 people shows a slight positive correlation between the proportion of Central American Indians and percentage of single father households in the United States with a correlation coefficient (R) of 0.087 and weighted average of 2.7%, a difference of 18.0%.
Single Father Households Correlation Summary
| Measurement | Venezuelan | Central American Indian |
| Minimum | 0.23% | 0.47% |
| Maximum | 4.4% | 16.1% |
| Range | 4.1% | 15.6% |
| Mean | 2.2% | 4.3% |
| Median | 2.2% | 3.0% |
| Interquartile 25% (IQ1) | 1.9% | 2.5% |
| Interquartile 75% (IQ3) | 2.7% | 5.0% |
| Interquartile Range (IQR) | 0.71% | 2.5% |
| Standard Deviation (Sample) | 0.73% | 3.0% |
| Standard Deviation (Population) | 0.72% | 3.0% |
Similar Demographics by Single Father Households
Demographics Similar to Venezuelans by Single Father Households
In terms of single father households, the demographic groups most similar to Venezuelans are Immigrants from Syria (2.3%, a difference of 0.21%), Senegalese (2.3%, a difference of 0.38%), South American Indian (2.3%, a difference of 0.39%), Immigrants from Venezuela (2.3%, a difference of 0.44%), and Slavic (2.2%, a difference of 0.49%).
| Demographics | Rating | Rank | Single Father Households |
| Immigrants | Nepal | 92.1 /100 | #143 | Exceptional 2.2% |
| Slovaks | 90.7 /100 | #144 | Exceptional 2.2% |
| Immigrants | Zimbabwe | 90.2 /100 | #145 | Exceptional 2.2% |
| Northern Europeans | 89.8 /100 | #146 | Excellent 2.2% |
| Slavs | 88.9 /100 | #147 | Excellent 2.2% |
| South American Indians | 88.5 /100 | #148 | Excellent 2.3% |
| Senegalese | 88.4 /100 | #149 | Excellent 2.3% |
| Venezuelans | 86.2 /100 | #150 | Excellent 2.3% |
| Immigrants | Syria | 84.8 /100 | #151 | Excellent 2.3% |
| Immigrants | Venezuela | 83.2 /100 | #152 | Excellent 2.3% |
| Immigrants | Germany | 82.8 /100 | #153 | Excellent 2.3% |
| Bolivians | 81.0 /100 | #154 | Excellent 2.3% |
| Europeans | 80.9 /100 | #155 | Excellent 2.3% |
| Immigrants | South America | 79.9 /100 | #156 | Good 2.3% |
| Canadians | 79.7 /100 | #157 | Good 2.3% |
Demographics Similar to Central American Indians by Single Father Households
In terms of single father households, the demographic groups most similar to Central American Indians are Ottawa (2.7%, a difference of 0.16%), Immigrants from Cuba (2.7%, a difference of 0.16%), Hawaiian (2.7%, a difference of 0.25%), Immigrants from Cambodia (2.7%, a difference of 0.25%), and Immigrants from Nicaragua (2.7%, a difference of 0.31%).
| Demographics | Rating | Rank | Single Father Households |
| Immigrants | Portugal | 0.1 /100 | #280 | Tragic 2.6% |
| Nicaraguans | 0.1 /100 | #281 | Tragic 2.6% |
| Dutch West Indians | 0.1 /100 | #282 | Tragic 2.6% |
| Immigrants | Nicaragua | 0.1 /100 | #283 | Tragic 2.7% |
| Hawaiians | 0.1 /100 | #284 | Tragic 2.7% |
| Ottawa | 0.1 /100 | #285 | Tragic 2.7% |
| Immigrants | Cuba | 0.1 /100 | #286 | Tragic 2.7% |
| Central American Indians | 0.0 /100 | #287 | Tragic 2.7% |
| Immigrants | Cambodia | 0.0 /100 | #288 | Tragic 2.7% |
| Tlingit-Haida | 0.0 /100 | #289 | Tragic 2.7% |
| Puget Sound Salish | 0.0 /100 | #290 | Tragic 2.7% |
| Blackfeet | 0.0 /100 | #291 | Tragic 2.7% |
| Choctaw | 0.0 /100 | #292 | Tragic 2.7% |
| Immigrants | Fiji | 0.0 /100 | #293 | Tragic 2.7% |
| Malaysians | 0.0 /100 | #294 | Tragic 2.7% |