Venezuelan vs Central American Indian Female Poverty Among 25-34 Year Olds

COMPARE

Venezuelan
Race
Ancestry
AfghanAfricanAlaska NativeAlaskan AthabascanAlbanianAleutAlsatianAmericanApacheArabArapahoArgentineanArmenianAssyrian/Chaldean/SyriacAustralianAustrianBahamianBangladeshiBarbadianBasqueBelgianBelizeanBermudanBhutaneseBlackfeetBolivianBrazilianBritishBritish West IndianBulgarianBurmeseCajunCambodianCanadianCape VerdeanCarpatho RusynCelticCentral AmericanCherokeeCheyenneChickasawChileanChineseChippewaChoctawColombianColvilleComancheCosta RicanCreeCreekCroatianCrowCubanCypriotCzechCzechoslovakianDanishDelawareDominicanDutchDutch West IndianEastern EuropeanEcuadorianEgyptianEnglishEstonianEthiopianEuropeanFijianFilipinoFinnishFrenchFrench American IndianFrench CanadianGermanGerman RussianGhanaianGreekGuamanian/ChamorroGuatemalanGuyaneseHaitianHmongHonduranHopiHoumaHungarianIcelanderIndian (Asian)IndonesianInupiatIranianIraqiIrishIroquoisIsraeliItalianJamaicanJapaneseJordanianKenyanKiowaKoreanLaotianLatvianLebaneseLiberianLithuanianLumbeeLuxembourgerMacedonianMalaysianMalteseMarshalleseMenomineeMexicanMexican American IndianMongolianMoroccanNative HawaiianNavajoNepaleseNew ZealanderNicaraguanNigerianNorthern EuropeanNorwegianOkinawanOsageOttawaPaiutePakistaniPalestinianPanamanianParaguayanPennsylvania GermanPeruvianPimaPolishPortuguesePotawatomiPuebloPuerto RicanPuget Sound SalishRomanianRussianSalvadoranSamoanScandinavianScotch-IrishScottishSeminoleSenegaleseSerbianShoshoneSierra LeoneanSiouxSlavicSlovakSloveneSomaliSouth AfricanSouth AmericanSouth American IndianSoviet UnionSpaniardSpanishSpanish AmericanSpanish American IndianSri LankanSubsaharan AfricanSudaneseSwedishSwissSyrianTaiwaneseThaiTlingit-HaidaTohono O'OdhamTonganTrinidadian and TobagonianTsimshianTurkishU.S. Virgin IslanderUgandanUkrainianUruguayanUteVenezuelanVietnameseWelshWest IndianYakamaYaquiYugoslavianYumanYup'ikZimbabwean
Immigration
NonimmigrantsImmigrantsAfghanistanAfricaAlbaniaArgentinaArmeniaAsiaAustraliaAustriaBahamasBangladeshBarbadosBelarusBelgiumBelizeBoliviaBosnia and HerzegovinaBrazilBulgariaBurma/MyanmarCabo VerdeCambodiaCameroonCanadaCaribbeanCentral AmericaChileChinaColombiaCongoCosta RicaCroatiaCubaCzechoslovakiaDenmarkDominicaDominican RepublicEastern AfricaEastern AsiaEastern EuropeEcuadorEgyptEl SalvadorEnglandEritreaEthiopiaEuropeFijiFranceGermanyGhanaGreeceGrenadaGuatemalaGuyanaHaitiHondurasHong KongHungaryIndiaIndonesiaIranIraqIrelandIsraelItalyJamaicaJapanJordanKazakhstanKenyaKoreaKuwaitLaosLatin AmericaLatviaLebanonLiberiaLithuaniaMalaysiaMexicoMicronesiaMiddle AfricaMoldovaMoroccoNepalNetherlandsNicaraguaNigeriaNorth AmericaNorth MacedoniaNorthern AfricaNorthern EuropeNorwayOceaniaPakistanPanamaPeruPhilippinesPolandPortugalRomaniaRussiaSaudi ArabiaScotlandSenegalSerbiaSierra LeoneSingaporeSomaliaSouth AfricaSouth AmericaSouth Central AsiaSouth Eastern AsiaSouthern EuropeSpainSri LankaSt. Vincent and the GrenadinesSudanSwedenSwitzerlandSyriaTaiwanThailandTrinidad and TobagoTurkeyUgandaUkraineUruguayUzbekistanVenezuelaVietnamWest IndiesWestern AfricaWestern AsiaWestern EuropeYemenZaireZimbabweAzores
Central American Indian
Race
Ancestry
AfghanAfricanAlaska NativeAlaskan AthabascanAlbanianAleutAlsatianAmericanApacheArabArapahoArgentineanArmenianAssyrian/Chaldean/SyriacAustralianAustrianBahamianBangladeshiBarbadianBasqueBelgianBelizeanBermudanBhutaneseBlackfeetBolivianBrazilianBritishBritish West IndianBulgarianBurmeseCajunCambodianCanadianCape VerdeanCarpatho RusynCelticCentral AmericanCentral American IndianCherokeeCheyenneChickasawChileanChineseChippewaChoctawColombianColvilleComancheCosta RicanCreeCreekCroatianCrowCubanCypriotCzechCzechoslovakianDanishDelawareDominicanDutchDutch West IndianEastern EuropeanEcuadorianEgyptianEnglishEstonianEthiopianEuropeanFijianFilipinoFinnishFrenchFrench American IndianFrench CanadianGermanGerman RussianGhanaianGreekGuamanian/ChamorroGuatemalanGuyaneseHaitianHmongHonduranHopiHoumaHungarianIcelanderIndian (Asian)IndonesianInupiatIranianIraqiIrishIroquoisIsraeliItalianJamaicanJapaneseJordanianKenyanKiowaKoreanLaotianLatvianLebaneseLiberianLithuanianLumbeeLuxembourgerMacedonianMalaysianMalteseMarshalleseMenomineeMexicanMexican American IndianMongolianMoroccanNative HawaiianNavajoNepaleseNew ZealanderNicaraguanNigerianNorthern EuropeanNorwegianOkinawanOsageOttawaPaiutePakistaniPalestinianPanamanianParaguayanPennsylvania GermanPeruvianPimaPolishPortuguesePotawatomiPuebloPuerto RicanPuget Sound SalishRomanianRussianSalvadoranSamoanScandinavianScotch-IrishScottishSeminoleSenegaleseSerbianShoshoneSierra LeoneanSiouxSlavicSlovakSloveneSomaliSouth AfricanSouth AmericanSouth American IndianSoviet UnionSpaniardSpanishSpanish AmericanSpanish American IndianSri LankanSubsaharan AfricanSudaneseSwedishSwissSyrianTaiwaneseThaiTlingit-HaidaTohono O'OdhamTonganTrinidadian and TobagonianTsimshianTurkishU.S. Virgin IslanderUgandanUkrainianUruguayanUteVietnameseWelshWest IndianYakamaYaquiYugoslavianYumanYup'ikZimbabwean
Immigration
NonimmigrantsImmigrantsAfghanistanAfricaAlbaniaArgentinaArmeniaAsiaAustraliaAustriaBahamasBangladeshBarbadosBelarusBelgiumBelizeBoliviaBosnia and HerzegovinaBrazilBulgariaBurma/MyanmarCabo VerdeCambodiaCameroonCanadaCaribbeanCentral AmericaChileChinaColombiaCongoCosta RicaCroatiaCubaCzechoslovakiaDenmarkDominicaDominican RepublicEastern AfricaEastern AsiaEastern EuropeEcuadorEgyptEl SalvadorEnglandEritreaEthiopiaEuropeFijiFranceGermanyGhanaGreeceGrenadaGuatemalaGuyanaHaitiHondurasHong KongHungaryIndiaIndonesiaIranIraqIrelandIsraelItalyJamaicaJapanJordanKazakhstanKenyaKoreaKuwaitLaosLatin AmericaLatviaLebanonLiberiaLithuaniaMalaysiaMexicoMicronesiaMiddle AfricaMoldovaMoroccoNepalNetherlandsNicaraguaNigeriaNorth AmericaNorth MacedoniaNorthern AfricaNorthern EuropeNorwayOceaniaPakistanPanamaPeruPhilippinesPolandPortugalRomaniaRussiaSaudi ArabiaScotlandSenegalSerbiaSierra LeoneSingaporeSomaliaSouth AfricaSouth AmericaSouth Central AsiaSouth Eastern AsiaSouthern EuropeSpainSri LankaSt. Vincent and the GrenadinesSudanSwedenSwitzerlandSyriaTaiwanThailandTrinidad and TobagoTurkeyUgandaUkraineUruguayUzbekistanVenezuelaVietnamWest IndiesWestern AfricaWestern AsiaWestern EuropeYemenZaireZimbabweAzores
Female Poverty Among 25-34 Year Olds
Income
Poverty
Unemployment
Labor Participation
Family Structure
Vehicle Availability
Education Level
Disability

Female Poverty Among 25-34 Year Olds Comparison

Venezuelans

Central American Indians

Average
Tragic
13.6%
FEMALE POVERTY AMONG 25-34 YEAR OLDS
44.6/ 100
METRIC RATING
177th/ 347
METRIC RANK
18.2%
FEMALE POVERTY AMONG 25-34 YEAR OLDS
0.0/ 100
METRIC RATING
322nd/ 347
METRIC RANK

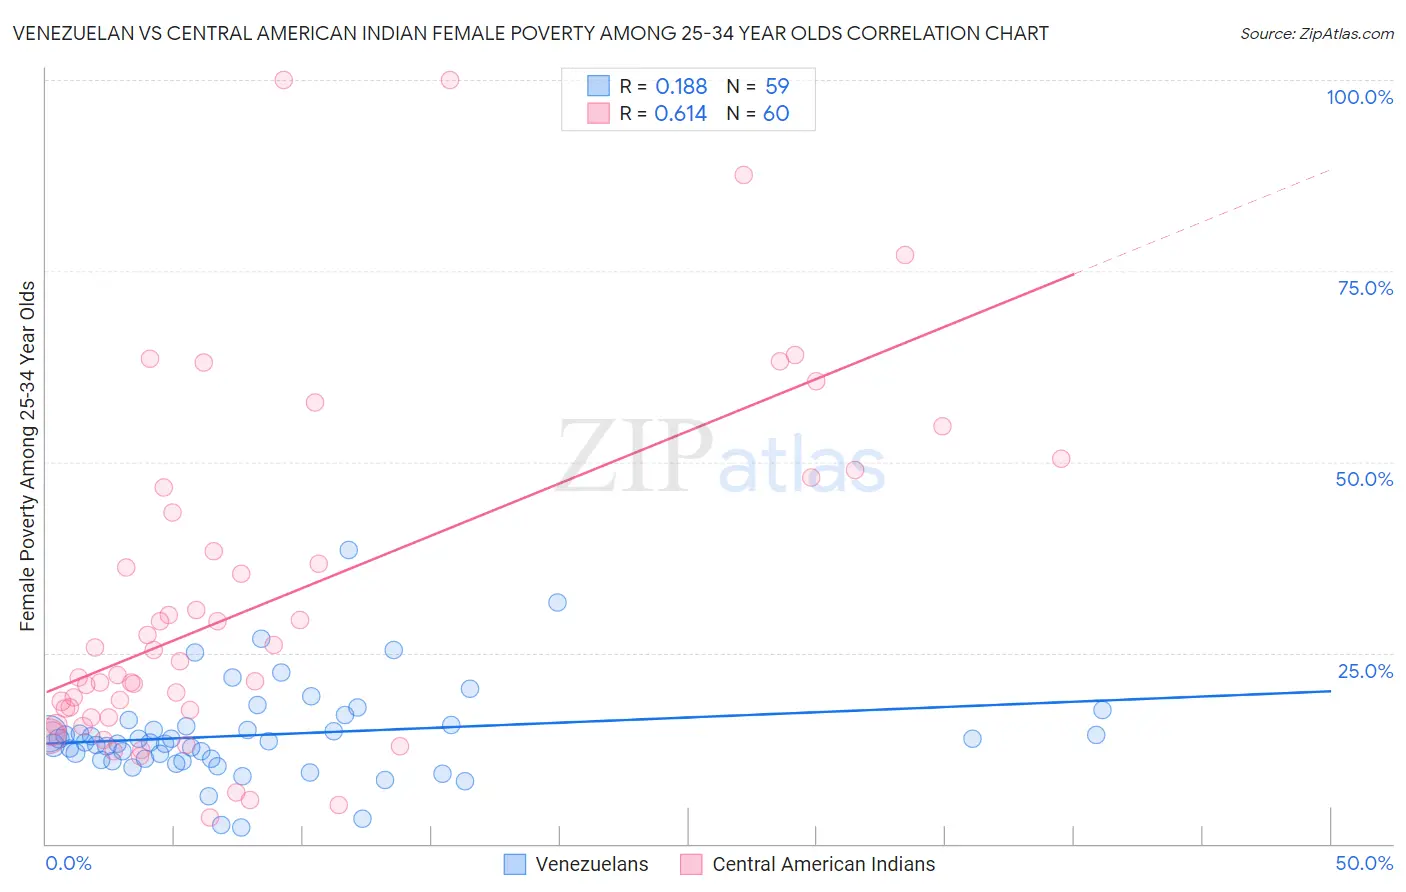
Venezuelan vs Central American Indian Female Poverty Among 25-34 Year Olds Correlation Chart

The statistical analysis conducted on geographies consisting of 303,104,079 people shows a poor positive correlation between the proportion of Venezuelans and poverty level among females between the ages 25 and 34 in the United States with a correlation coefficient (R) of 0.188 and weighted average of 13.6%. Similarly, the statistical analysis conducted on geographies consisting of 323,546,526 people shows a significant positive correlation between the proportion of Central American Indians and poverty level among females between the ages 25 and 34 in the United States with a correlation coefficient (R) of 0.614 and weighted average of 18.2%, a difference of 34.0%.
Venezuelan vs Central American Indian Female Poverty Among 25-34 Year Olds

Female Poverty Among 25-34 Year Olds Correlation Summary

MeasurementVenezuelanCentral American Indian
Minimum2.1%3.4%
Maximum38.5%100.0%
Range36.3%96.6%
Mean14.3%32.0%
Median13.3%23.0%
Interquartile 25% (IQ1)10.9%16.6%
Interquartile 75% (IQ3)15.6%45.0%
Interquartile Range (IQR)4.7%28.4%
Standard Deviation (Sample)6.3%22.8%
Standard Deviation (Population)6.2%22.6%

Similar Demographics by Female Poverty Among 25-34 Year Olds

Demographics Similar to Venezuelans by Female Poverty Among 25-34 Year Olds

In terms of female poverty among 25-34 year olds, the demographic groups most similar to Venezuelans are Yugoslavian (13.6%, a difference of 0.030%), Canadian (13.6%, a difference of 0.030%), Immigrants from Eastern Africa (13.6%, a difference of 0.090%), Bermudan (13.6%, a difference of 0.18%), and German (13.6%, a difference of 0.26%).
DemographicsRating | RankFemale Poverty Among 25-34 Year Olds
Immigrants | Uganda
53.0
/100
|
#170
Average
13.5%
South American Indians
51.9
/100
|
#171
Average
13.5%
Immigrants | Costa Rica
51.9
/100
|
#172
Average
13.5%
Kenyans
51.8
/100
|
#173
Average
13.5%
Immigrants | Oceania
50.0
/100
|
#174
Average
13.5%
Bermudans
46.8
/100
|
#175
Average
13.6%
Yugoslavians
45.0
/100
|
#176
Average
13.6%
Venezuelans
44.6
/100
|
#177
Average
13.6%
Canadians
44.3
/100
|
#178
Average
13.6%
Immigrants | Eastern Africa
43.6
/100
|
#179
Average
13.6%
Germans
41.6
/100
|
#180
Average
13.6%
Guamanians/Chamorros
41.5
/100
|
#181
Average
13.6%
Immigrants | Venezuela
40.7
/100
|
#182
Average
13.6%
Portuguese
40.3
/100
|
#183
Average
13.6%
Czechoslovakians
36.8
/100
|
#184
Fair
13.7%

Demographics Similar to Central American Indians by Female Poverty Among 25-34 Year Olds

In terms of female poverty among 25-34 year olds, the demographic groups most similar to Central American Indians are Seminole (18.3%, a difference of 0.32%), Choctaw (18.1%, a difference of 0.84%), Chippewa (18.0%, a difference of 1.1%), Dutch West Indian (18.4%, a difference of 1.3%), and Menominee (18.0%, a difference of 1.3%).
DemographicsRating | RankFemale Poverty Among 25-34 Year Olds
Yakama
0.0
/100
|
#315
Tragic
17.6%
Dominicans
0.0
/100
|
#316
Tragic
17.6%
Arapaho
0.0
/100
|
#317
Tragic
17.8%
Ute
0.0
/100
|
#318
Tragic
17.9%
Menominee
0.0
/100
|
#319
Tragic
18.0%
Chippewa
0.0
/100
|
#320
Tragic
18.0%
Choctaw
0.0
/100
|
#321
Tragic
18.1%
Central American Indians
0.0
/100
|
#322
Tragic
18.2%
Seminole
0.0
/100
|
#323
Tragic
18.3%
Dutch West Indians
0.0
/100
|
#324
Tragic
18.4%
Inupiat
0.0
/100
|
#325
Tragic
18.5%
Blacks/African Americans
0.0
/100
|
#326
Tragic
18.9%
Cheyenne
0.0
/100
|
#327
Tragic
19.1%
Alaskan Athabascans
0.0
/100
|
#328
Tragic
19.1%
Creek
0.0
/100
|
#329
Tragic
19.2%