Scottish vs Immigrants from Sweden Single Father Poverty
COMPARE
Scottish
Immigrants from Sweden
Single Father Poverty
Single Father Poverty Comparison
Scottish
Immigrants from Sweden
17.7%
SINGLE FATHER POVERTY
0.0/ 100
METRIC RATING
280th/ 347
METRIC RANK
15.2%
SINGLE FATHER POVERTY
99.8/ 100
METRIC RATING
63rd/ 347
METRIC RANK
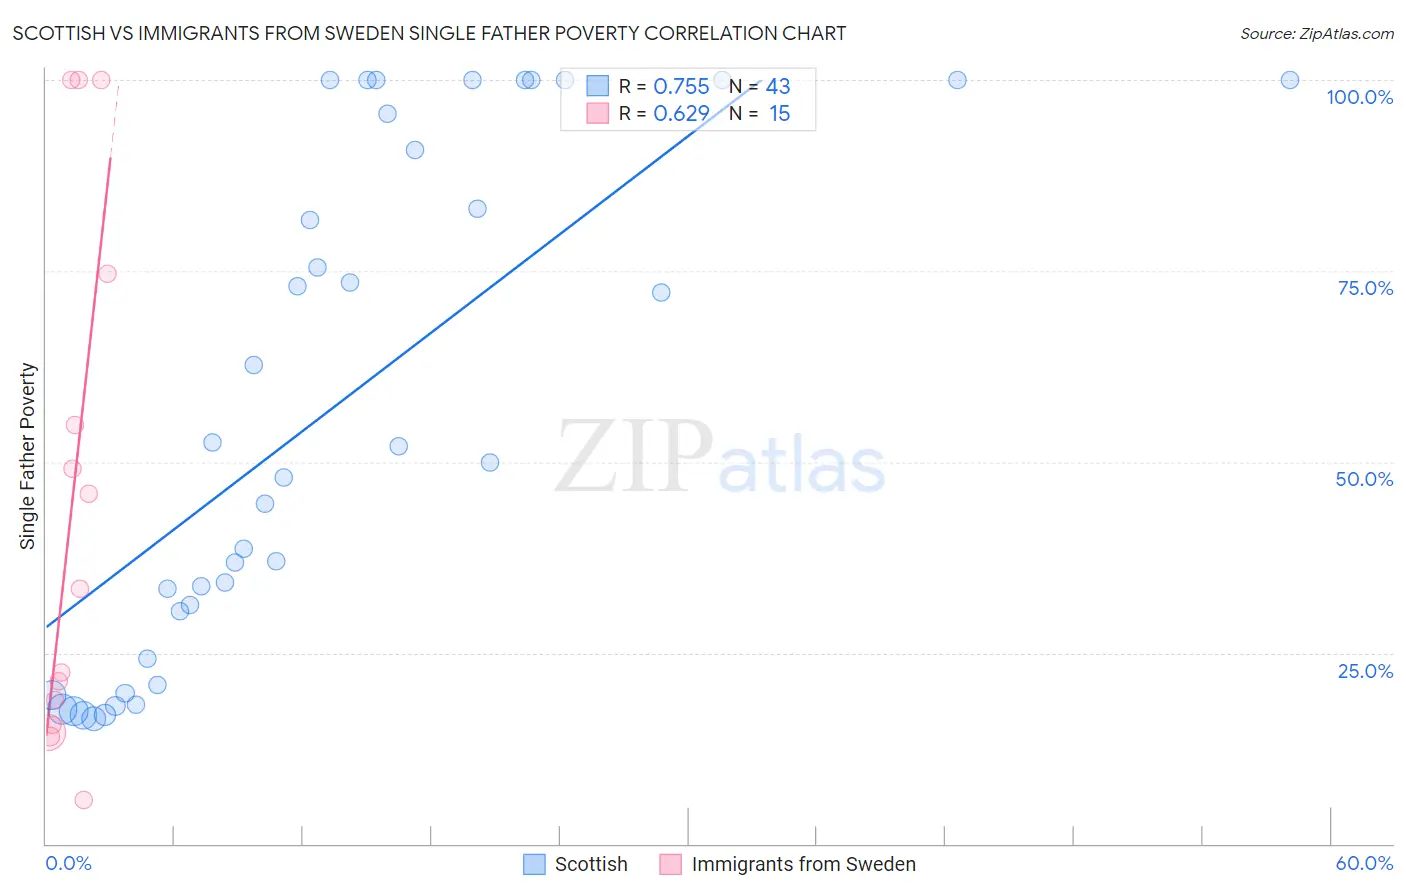
Scottish vs Immigrants from Sweden Single Father Poverty Correlation Chart
The statistical analysis conducted on geographies consisting of 405,098,352 people shows a strong positive correlation between the proportion of Scottish and poverty level among single fathers in the United States with a correlation coefficient (R) of 0.755 and weighted average of 17.7%. Similarly, the statistical analysis conducted on geographies consisting of 139,123,706 people shows a significant positive correlation between the proportion of Immigrants from Sweden and poverty level among single fathers in the United States with a correlation coefficient (R) of 0.629 and weighted average of 15.2%, a difference of 16.9%.
Single Father Poverty Correlation Summary
| Measurement | Scottish | Immigrants from Sweden |
| Minimum | 16.4% | 5.8% |
| Maximum | 100.0% | 100.0% |
| Range | 83.6% | 94.2% |
| Mean | 56.6% | 44.7% |
| Median | 50.0% | 33.3% |
| Interquartile 25% (IQ1) | 24.3% | 15.5% |
| Interquartile 75% (IQ3) | 95.6% | 74.7% |
| Interquartile Range (IQR) | 71.3% | 59.2% |
| Standard Deviation (Sample) | 32.4% | 34.1% |
| Standard Deviation (Population) | 32.1% | 32.9% |
Similar Demographics by Single Father Poverty
Demographics Similar to Scottish by Single Father Poverty
In terms of single father poverty, the demographic groups most similar to Scottish are Iroquois (17.7%, a difference of 0.050%), German (17.7%, a difference of 0.19%), Lebanese (17.7%, a difference of 0.20%), English (17.8%, a difference of 0.32%), and Dutch (17.8%, a difference of 0.32%).
| Demographics | Rating | Rank | Single Father Poverty |
| Italians | 0.1 /100 | #273 | Tragic 17.5% |
| Macedonians | 0.1 /100 | #274 | Tragic 17.7% |
| British West Indians | 0.0 /100 | #275 | Tragic 17.7% |
| German Russians | 0.0 /100 | #276 | Tragic 17.7% |
| Lebanese | 0.0 /100 | #277 | Tragic 17.7% |
| Germans | 0.0 /100 | #278 | Tragic 17.7% |
| Iroquois | 0.0 /100 | #279 | Tragic 17.7% |
| Scottish | 0.0 /100 | #280 | Tragic 17.7% |
| English | 0.0 /100 | #281 | Tragic 17.8% |
| Dutch | 0.0 /100 | #282 | Tragic 17.8% |
| Alsatians | 0.0 /100 | #283 | Tragic 17.8% |
| Welsh | 0.0 /100 | #284 | Tragic 17.8% |
| Immigrants | Lebanon | 0.0 /100 | #285 | Tragic 17.9% |
| Immigrants | North Macedonia | 0.0 /100 | #286 | Tragic 17.9% |
| Carpatho Rusyns | 0.0 /100 | #287 | Tragic 18.0% |
Demographics Similar to Immigrants from Sweden by Single Father Poverty
In terms of single father poverty, the demographic groups most similar to Immigrants from Sweden are Bangladeshi (15.2%, a difference of 0.080%), Immigrants from Armenia (15.2%, a difference of 0.090%), Immigrants from Bosnia and Herzegovina (15.2%, a difference of 0.10%), Puget Sound Salish (15.2%, a difference of 0.14%), and Immigrants from Malaysia (15.2%, a difference of 0.16%).
| Demographics | Rating | Rank | Single Father Poverty |
| Immigrants | Laos | 99.9 /100 | #56 | Exceptional 15.1% |
| Laotians | 99.9 /100 | #57 | Exceptional 15.1% |
| Hawaiians | 99.9 /100 | #58 | Exceptional 15.1% |
| Guamanians/Chamorros | 99.9 /100 | #59 | Exceptional 15.1% |
| Puget Sound Salish | 99.8 /100 | #60 | Exceptional 15.2% |
| Immigrants | Bosnia and Herzegovina | 99.8 /100 | #61 | Exceptional 15.2% |
| Immigrants | Armenia | 99.8 /100 | #62 | Exceptional 15.2% |
| Immigrants | Sweden | 99.8 /100 | #63 | Exceptional 15.2% |
| Bangladeshis | 99.8 /100 | #64 | Exceptional 15.2% |
| Immigrants | Malaysia | 99.8 /100 | #65 | Exceptional 15.2% |
| Immigrants | Moldova | 99.8 /100 | #66 | Exceptional 15.2% |
| Paraguayans | 99.7 /100 | #67 | Exceptional 15.2% |
| Immigrants | Cameroon | 99.7 /100 | #68 | Exceptional 15.2% |
| Japanese | 99.7 /100 | #69 | Exceptional 15.2% |
| Mongolians | 99.7 /100 | #70 | Exceptional 15.3% |