Immigrants from Belarus vs Immigrants from Caribbean Female Poverty
COMPARE
Immigrants from Belarus
Immigrants from Caribbean
Female Poverty
Female Poverty Comparison
Immigrants from Belarus
Immigrants from Caribbean
12.8%
FEMALE POVERTY
88.2/ 100
METRIC RATING
128th/ 347
METRIC RANK
16.9%
FEMALE POVERTY
0.0/ 100
METRIC RATING
306th/ 347
METRIC RANK
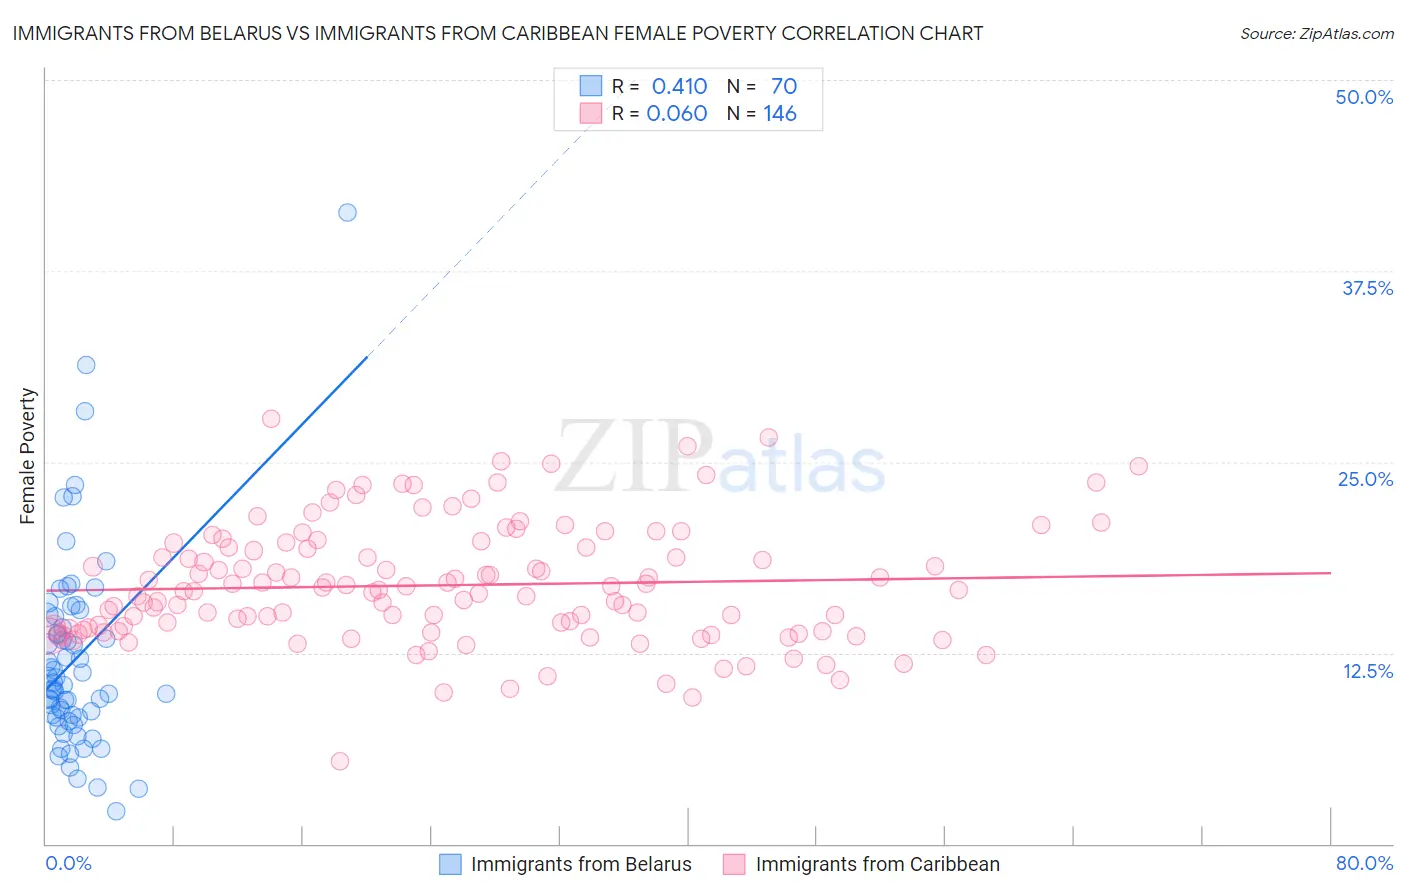
Immigrants from Belarus vs Immigrants from Caribbean Female Poverty Correlation Chart
The statistical analysis conducted on geographies consisting of 150,175,369 people shows a moderate positive correlation between the proportion of Immigrants from Belarus and poverty level among females in the United States with a correlation coefficient (R) of 0.410 and weighted average of 12.8%. Similarly, the statistical analysis conducted on geographies consisting of 449,490,616 people shows a slight positive correlation between the proportion of Immigrants from Caribbean and poverty level among females in the United States with a correlation coefficient (R) of 0.060 and weighted average of 16.9%, a difference of 31.9%.
Female Poverty Correlation Summary
| Measurement | Immigrants from Belarus | Immigrants from Caribbean |
| Minimum | 2.1% | 5.4% |
| Maximum | 41.3% | 27.8% |
| Range | 39.2% | 22.4% |
| Mean | 12.1% | 16.9% |
| Median | 10.5% | 16.6% |
| Interquartile 25% (IQ1) | 8.3% | 14.0% |
| Interquartile 75% (IQ3) | 14.9% | 19.4% |
| Interquartile Range (IQR) | 6.6% | 5.3% |
| Standard Deviation (Sample) | 6.5% | 3.9% |
| Standard Deviation (Population) | 6.5% | 3.9% |
Similar Demographics by Female Poverty
Demographics Similar to Immigrants from Belarus by Female Poverty
In terms of female poverty, the demographic groups most similar to Immigrants from Belarus are South African (12.8%, a difference of 0.040%), Immigrants from Brazil (12.8%, a difference of 0.070%), Immigrants from Ukraine (12.8%, a difference of 0.14%), Argentinean (12.8%, a difference of 0.22%), and Immigrants from Norway (12.8%, a difference of 0.27%).
| Demographics | Rating | Rank | Female Poverty |
| Immigrants | Hungary | 90.3 /100 | #121 | Exceptional 12.7% |
| French Canadians | 90.2 /100 | #122 | Exceptional 12.7% |
| Immigrants | South Eastern Asia | 89.9 /100 | #123 | Excellent 12.7% |
| Immigrants | Norway | 89.3 /100 | #124 | Excellent 12.8% |
| Argentineans | 89.1 /100 | #125 | Excellent 12.8% |
| Immigrants | Ukraine | 88.8 /100 | #126 | Excellent 12.8% |
| South Africans | 88.4 /100 | #127 | Excellent 12.8% |
| Immigrants | Belarus | 88.2 /100 | #128 | Excellent 12.8% |
| Immigrants | Brazil | 87.9 /100 | #129 | Excellent 12.8% |
| Immigrants | Vietnam | 87.1 /100 | #130 | Excellent 12.8% |
| Immigrants | Argentina | 87.0 /100 | #131 | Excellent 12.8% |
| Immigrants | Jordan | 86.9 /100 | #132 | Excellent 12.8% |
| Immigrants | Western Europe | 86.6 /100 | #133 | Excellent 12.8% |
| Immigrants | Switzerland | 85.8 /100 | #134 | Excellent 12.9% |
| French | 85.6 /100 | #135 | Excellent 12.9% |
Demographics Similar to Immigrants from Caribbean by Female Poverty
In terms of female poverty, the demographic groups most similar to Immigrants from Caribbean are Seminole (16.9%, a difference of 0.12%), African (16.9%, a difference of 0.19%), Immigrants from Central America (16.8%, a difference of 0.27%), Immigrants from Grenada (16.8%, a difference of 0.27%), and Choctaw (16.8%, a difference of 0.33%).
| Demographics | Rating | Rank | Female Poverty |
| Hispanics or Latinos | 0.0 /100 | #299 | Tragic 16.6% |
| Bahamians | 0.0 /100 | #300 | Tragic 16.6% |
| Guatemalans | 0.0 /100 | #301 | Tragic 16.7% |
| Chippewa | 0.0 /100 | #302 | Tragic 16.7% |
| Choctaw | 0.0 /100 | #303 | Tragic 16.8% |
| Immigrants | Central America | 0.0 /100 | #304 | Tragic 16.8% |
| Immigrants | Grenada | 0.0 /100 | #305 | Tragic 16.8% |
| Immigrants | Caribbean | 0.0 /100 | #306 | Tragic 16.9% |
| Seminole | 0.0 /100 | #307 | Tragic 16.9% |
| Africans | 0.0 /100 | #308 | Tragic 16.9% |
| Immigrants | Mexico | 0.0 /100 | #309 | Tragic 17.0% |
| Creek | 0.0 /100 | #310 | Tragic 17.0% |
| Immigrants | Guatemala | 0.0 /100 | #311 | Tragic 17.0% |
| Immigrants | Somalia | 0.0 /100 | #312 | Tragic 17.0% |
| British West Indians | 0.0 /100 | #313 | Tragic 17.0% |