Alsatian vs Immigrants from Caribbean Female Poverty
COMPARE
Alsatian
Immigrants from Caribbean
Female Poverty
Female Poverty Comparison
Alsatians
Immigrants from Caribbean
14.5%
FEMALE POVERTY
4.0/ 100
METRIC RATING
220th/ 347
METRIC RANK
16.9%
FEMALE POVERTY
0.0/ 100
METRIC RATING
306th/ 347
METRIC RANK
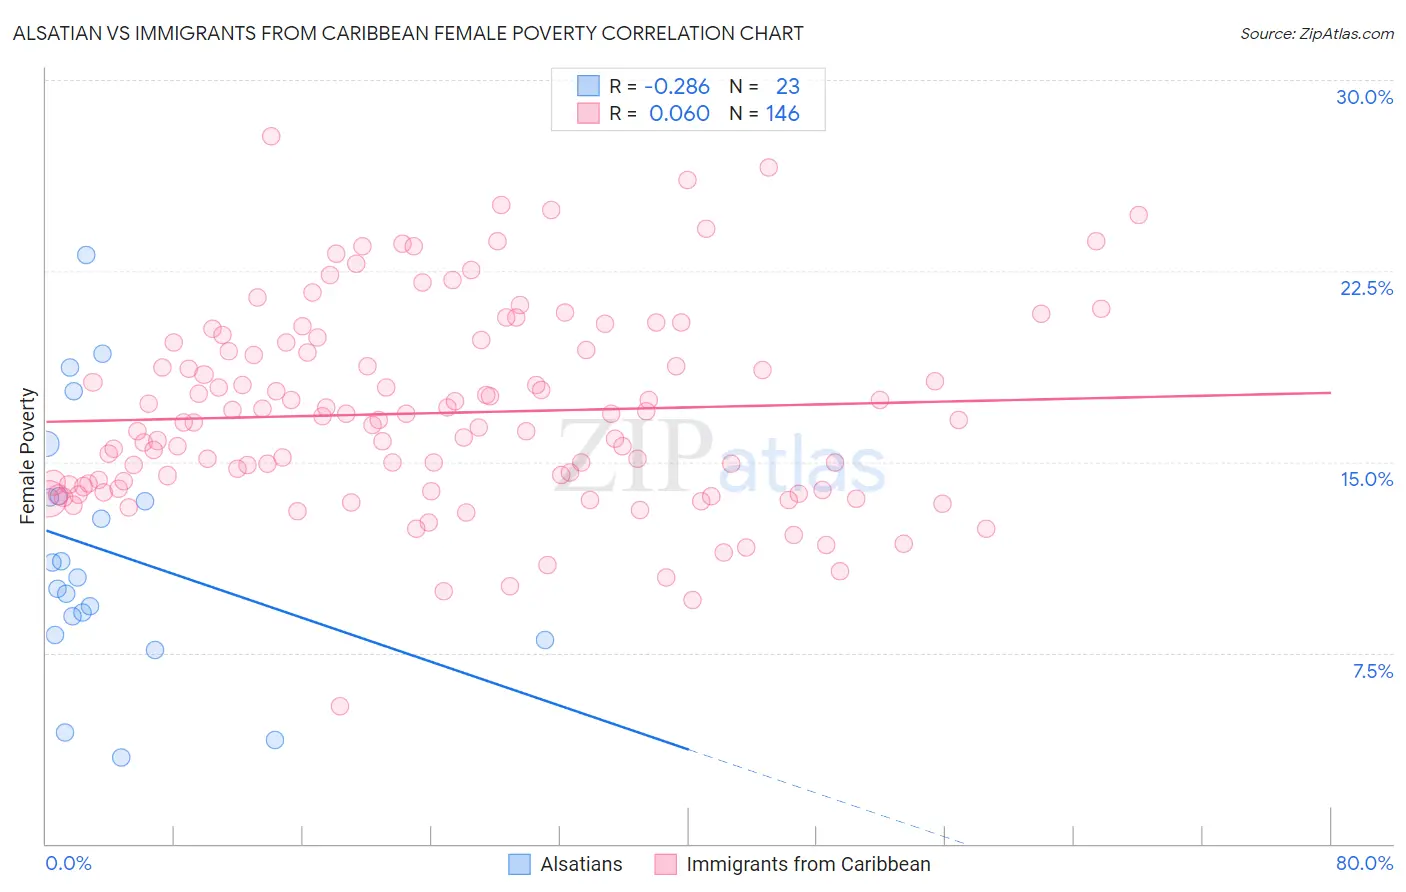
Alsatian vs Immigrants from Caribbean Female Poverty Correlation Chart
The statistical analysis conducted on geographies consisting of 82,678,421 people shows a weak negative correlation between the proportion of Alsatians and poverty level among females in the United States with a correlation coefficient (R) of -0.286 and weighted average of 14.5%. Similarly, the statistical analysis conducted on geographies consisting of 449,490,616 people shows a slight positive correlation between the proportion of Immigrants from Caribbean and poverty level among females in the United States with a correlation coefficient (R) of 0.060 and weighted average of 16.9%, a difference of 16.6%.
Female Poverty Correlation Summary
| Measurement | Alsatian | Immigrants from Caribbean |
| Minimum | 3.4% | 5.4% |
| Maximum | 23.1% | 27.8% |
| Range | 19.7% | 22.4% |
| Mean | 11.5% | 16.9% |
| Median | 10.5% | 16.6% |
| Interquartile 25% (IQ1) | 8.2% | 14.0% |
| Interquartile 75% (IQ3) | 13.7% | 19.4% |
| Interquartile Range (IQR) | 5.5% | 5.3% |
| Standard Deviation (Sample) | 5.0% | 3.9% |
| Standard Deviation (Population) | 4.9% | 3.9% |
Similar Demographics by Female Poverty
Demographics Similar to Alsatians by Female Poverty
In terms of female poverty, the demographic groups most similar to Alsatians are Japanese (14.5%, a difference of 0.050%), Immigrants from Uzbekistan (14.4%, a difference of 0.18%), Immigrants from Cambodia (14.5%, a difference of 0.19%), Nonimmigrants (14.5%, a difference of 0.22%), and Immigrants (14.4%, a difference of 0.23%).
| Demographics | Rating | Rank | Female Poverty |
| Alaskan Athabascans | 5.3 /100 | #213 | Tragic 14.4% |
| Marshallese | 5.0 /100 | #214 | Tragic 14.4% |
| Immigrants | Panama | 4.7 /100 | #215 | Tragic 14.4% |
| Immigrants | Thailand | 4.5 /100 | #216 | Tragic 14.4% |
| Immigrants | Immigrants | 4.5 /100 | #217 | Tragic 14.4% |
| Immigrants | Uzbekistan | 4.4 /100 | #218 | Tragic 14.4% |
| Japanese | 4.1 /100 | #219 | Tragic 14.5% |
| Alsatians | 4.0 /100 | #220 | Tragic 14.5% |
| Immigrants | Cambodia | 3.7 /100 | #221 | Tragic 14.5% |
| Immigrants | Nonimmigrants | 3.7 /100 | #222 | Tragic 14.5% |
| Immigrants | Africa | 3.3 /100 | #223 | Tragic 14.5% |
| Americans | 2.8 /100 | #224 | Tragic 14.6% |
| Immigrants | Micronesia | 2.8 /100 | #225 | Tragic 14.6% |
| Immigrants | Eritrea | 2.4 /100 | #226 | Tragic 14.6% |
| Immigrants | Nigeria | 2.1 /100 | #227 | Tragic 14.7% |
Demographics Similar to Immigrants from Caribbean by Female Poverty
In terms of female poverty, the demographic groups most similar to Immigrants from Caribbean are Seminole (16.9%, a difference of 0.12%), African (16.9%, a difference of 0.19%), Immigrants from Central America (16.8%, a difference of 0.27%), Immigrants from Grenada (16.8%, a difference of 0.27%), and Choctaw (16.8%, a difference of 0.33%).
| Demographics | Rating | Rank | Female Poverty |
| Hispanics or Latinos | 0.0 /100 | #299 | Tragic 16.6% |
| Bahamians | 0.0 /100 | #300 | Tragic 16.6% |
| Guatemalans | 0.0 /100 | #301 | Tragic 16.7% |
| Chippewa | 0.0 /100 | #302 | Tragic 16.7% |
| Choctaw | 0.0 /100 | #303 | Tragic 16.8% |
| Immigrants | Central America | 0.0 /100 | #304 | Tragic 16.8% |
| Immigrants | Grenada | 0.0 /100 | #305 | Tragic 16.8% |
| Immigrants | Caribbean | 0.0 /100 | #306 | Tragic 16.9% |
| Seminole | 0.0 /100 | #307 | Tragic 16.9% |
| Africans | 0.0 /100 | #308 | Tragic 16.9% |
| Immigrants | Mexico | 0.0 /100 | #309 | Tragic 17.0% |
| Creek | 0.0 /100 | #310 | Tragic 17.0% |
| Immigrants | Guatemala | 0.0 /100 | #311 | Tragic 17.0% |
| Immigrants | Somalia | 0.0 /100 | #312 | Tragic 17.0% |
| British West Indians | 0.0 /100 | #313 | Tragic 17.0% |