Tsimshian vs Immigrants from Caribbean Female Disability
COMPARE
Tsimshian
Immigrants from Caribbean
Female Disability
Female Disability Comparison
Tsimshian
Immigrants from Caribbean
16.8%
FEMALE DISABILITY
0.0/ 100
METRIC RATING
346th/ 347
METRIC RANK
12.7%
FEMALE DISABILITY
1.4/ 100
METRIC RATING
252nd/ 347
METRIC RANK
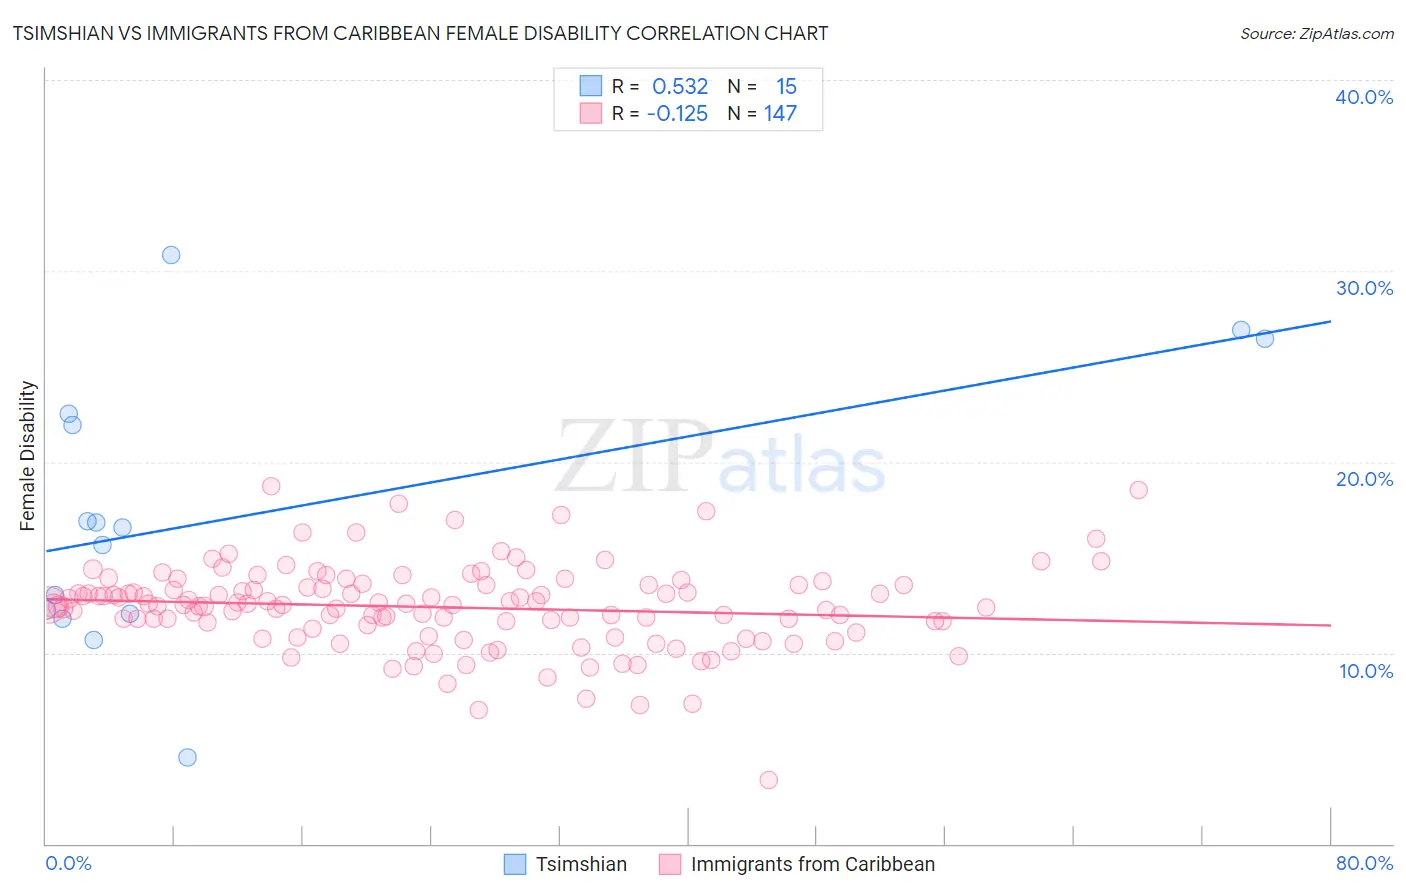
Tsimshian vs Immigrants from Caribbean Female Disability Correlation Chart
The statistical analysis conducted on geographies consisting of 15,626,462 people shows a substantial positive correlation between the proportion of Tsimshian and percentage of females with a disability in the United States with a correlation coefficient (R) of 0.532 and weighted average of 16.8%. Similarly, the statistical analysis conducted on geographies consisting of 449,918,897 people shows a poor negative correlation between the proportion of Immigrants from Caribbean and percentage of females with a disability in the United States with a correlation coefficient (R) of -0.125 and weighted average of 12.7%, a difference of 32.3%.
Female Disability Correlation Summary
| Measurement | Tsimshian | Immigrants from Caribbean |
| Minimum | 4.5% | 3.3% |
| Maximum | 30.9% | 18.7% |
| Range | 26.4% | 15.4% |
| Mean | 17.3% | 12.4% |
| Median | 16.6% | 12.5% |
| Interquartile 25% (IQ1) | 12.0% | 11.3% |
| Interquartile 75% (IQ3) | 22.5% | 13.5% |
| Interquartile Range (IQR) | 10.5% | 2.3% |
| Standard Deviation (Sample) | 7.2% | 2.2% |
| Standard Deviation (Population) | 6.9% | 2.2% |
Similar Demographics by Female Disability
Demographics Similar to Tsimshian by Female Disability
In terms of female disability, the demographic groups most similar to Tsimshian are Houma (16.9%, a difference of 0.77%), Puerto Rican (16.6%, a difference of 0.94%), Kiowa (15.8%, a difference of 6.2%), Lumbee (15.8%, a difference of 6.3%), and Creek (15.7%, a difference of 7.1%).
| Demographics | Rating | Rank | Female Disability |
| Immigrants | Azores | 0.0 /100 | #333 | Tragic 14.9% |
| Cherokee | 0.0 /100 | #334 | Tragic 14.9% |
| Cajuns | 0.0 /100 | #335 | Tragic 14.9% |
| Seminole | 0.0 /100 | #336 | Tragic 15.0% |
| Tohono O'odham | 0.0 /100 | #337 | Tragic 15.0% |
| Dutch West Indians | 0.0 /100 | #338 | Tragic 15.0% |
| Colville | 0.0 /100 | #339 | Tragic 15.1% |
| Chickasaw | 0.0 /100 | #340 | Tragic 15.2% |
| Choctaw | 0.0 /100 | #341 | Tragic 15.4% |
| Creek | 0.0 /100 | #342 | Tragic 15.7% |
| Lumbee | 0.0 /100 | #343 | Tragic 15.8% |
| Kiowa | 0.0 /100 | #344 | Tragic 15.8% |
| Puerto Ricans | 0.0 /100 | #345 | Tragic 16.6% |
| Tsimshian | 0.0 /100 | #346 | Tragic 16.8% |
| Houma | 0.0 /100 | #347 | Tragic 16.9% |
Demographics Similar to Immigrants from Caribbean by Female Disability
In terms of female disability, the demographic groups most similar to Immigrants from Caribbean are Jamaican (12.7%, a difference of 0.010%), Hawaiian (12.7%, a difference of 0.040%), Crow (12.7%, a difference of 0.080%), Immigrants from Germany (12.7%, a difference of 0.12%), and Slovene (12.7%, a difference of 0.14%).
| Demographics | Rating | Rank | Female Disability |
| Immigrants | Jamaica | 2.2 /100 | #245 | Tragic 12.6% |
| Spanish American Indians | 2.1 /100 | #246 | Tragic 12.6% |
| Menominee | 2.1 /100 | #247 | Tragic 12.6% |
| Carpatho Rusyns | 2.0 /100 | #248 | Tragic 12.6% |
| Immigrants | Congo | 1.8 /100 | #249 | Tragic 12.7% |
| Slovenes | 1.7 /100 | #250 | Tragic 12.7% |
| Crow | 1.6 /100 | #251 | Tragic 12.7% |
| Immigrants | Caribbean | 1.4 /100 | #252 | Tragic 12.7% |
| Jamaicans | 1.4 /100 | #253 | Tragic 12.7% |
| Hawaiians | 1.4 /100 | #254 | Tragic 12.7% |
| Immigrants | Germany | 1.3 /100 | #255 | Tragic 12.7% |
| British West Indians | 1.2 /100 | #256 | Tragic 12.7% |
| Liberians | 1.1 /100 | #257 | Tragic 12.7% |
| Aleuts | 1.1 /100 | #258 | Tragic 12.7% |
| Immigrants | Armenia | 1.0 /100 | #259 | Tragic 12.7% |