Ugandan vs Immigrants from Caribbean Female Poverty
COMPARE
Ugandan
Immigrants from Caribbean
Female Poverty
Female Poverty Comparison
Ugandans
Immigrants from Caribbean
14.0%
FEMALE POVERTY
15.4/ 100
METRIC RATING
205th/ 347
METRIC RANK
16.9%
FEMALE POVERTY
0.0/ 100
METRIC RATING
306th/ 347
METRIC RANK
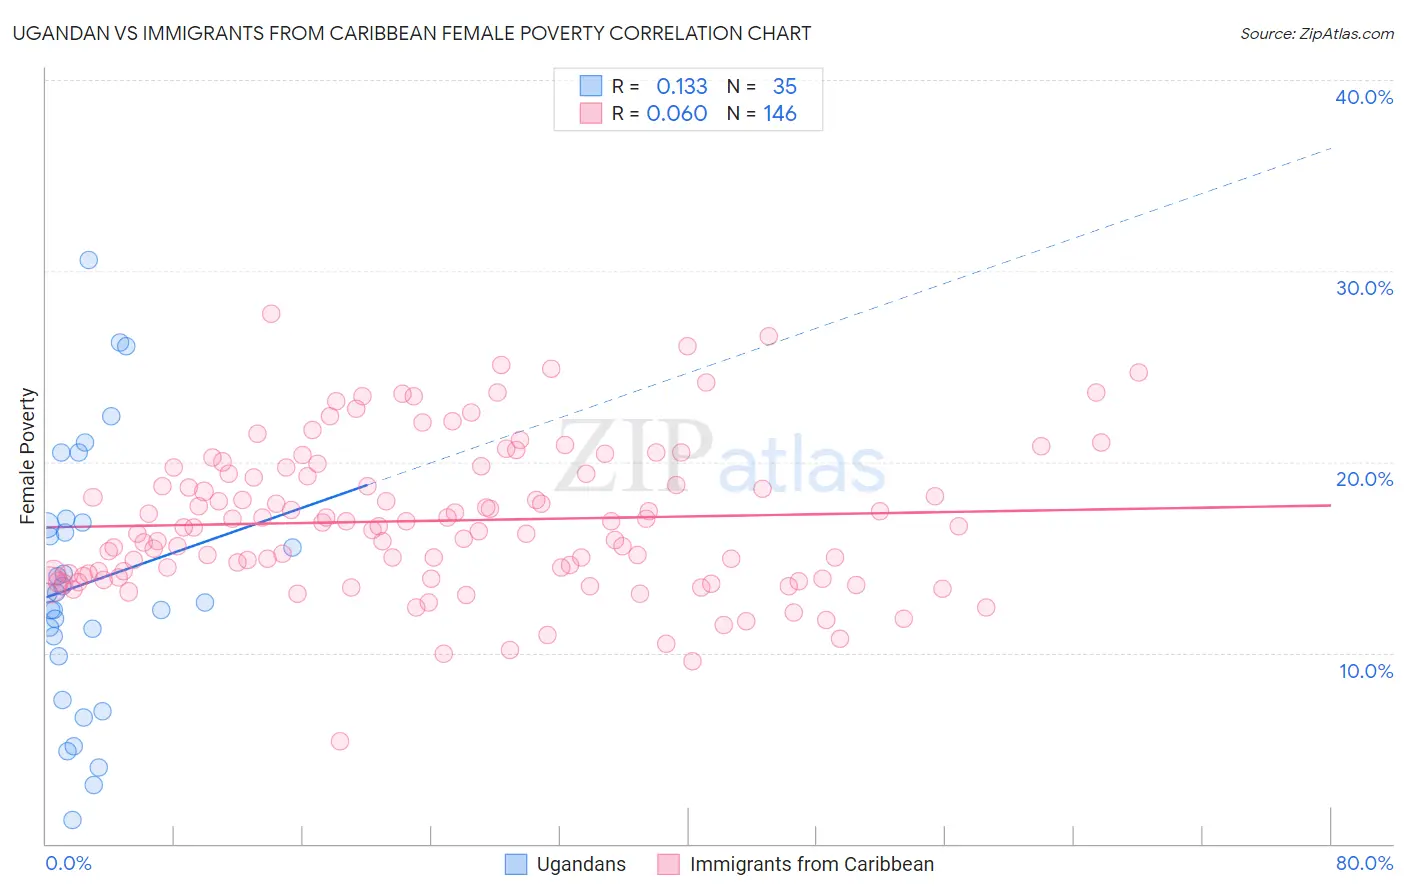
Ugandan vs Immigrants from Caribbean Female Poverty Correlation Chart
The statistical analysis conducted on geographies consisting of 93,995,237 people shows a poor positive correlation between the proportion of Ugandans and poverty level among females in the United States with a correlation coefficient (R) of 0.133 and weighted average of 14.0%. Similarly, the statistical analysis conducted on geographies consisting of 449,490,616 people shows a slight positive correlation between the proportion of Immigrants from Caribbean and poverty level among females in the United States with a correlation coefficient (R) of 0.060 and weighted average of 16.9%, a difference of 20.5%.
Female Poverty Correlation Summary
| Measurement | Ugandan | Immigrants from Caribbean |
| Minimum | 1.3% | 5.4% |
| Maximum | 30.6% | 27.8% |
| Range | 29.3% | 22.4% |
| Mean | 13.6% | 16.9% |
| Median | 13.1% | 16.6% |
| Interquartile 25% (IQ1) | 9.8% | 14.0% |
| Interquartile 75% (IQ3) | 16.8% | 19.4% |
| Interquartile Range (IQR) | 7.0% | 5.3% |
| Standard Deviation (Sample) | 6.8% | 3.9% |
| Standard Deviation (Population) | 6.7% | 3.9% |
Similar Demographics by Female Poverty
Demographics Similar to Ugandans by Female Poverty
In terms of female poverty, the demographic groups most similar to Ugandans are Immigrants from Uruguay (14.0%, a difference of 0.27%), Spaniard (13.9%, a difference of 0.56%), Immigrants from Western Asia (13.9%, a difference of 0.84%), Hmong (13.9%, a difference of 0.89%), and Immigrants from Kenya (13.9%, a difference of 0.90%).
| Demographics | Rating | Rank | Female Poverty |
| Immigrants | Uganda | 28.5 /100 | #198 | Fair 13.7% |
| Immigrants | Lebanon | 25.6 /100 | #199 | Fair 13.8% |
| Spanish | 21.4 /100 | #200 | Fair 13.9% |
| Immigrants | Kenya | 21.1 /100 | #201 | Fair 13.9% |
| Hmong | 21.1 /100 | #202 | Fair 13.9% |
| Immigrants | Western Asia | 20.7 /100 | #203 | Fair 13.9% |
| Spaniards | 18.9 /100 | #204 | Poor 13.9% |
| Ugandans | 15.4 /100 | #205 | Poor 14.0% |
| Immigrants | Uruguay | 14.0 /100 | #206 | Poor 14.0% |
| Immigrants | Eastern Africa | 9.0 /100 | #207 | Tragic 14.2% |
| Immigrants | Azores | 7.9 /100 | #208 | Tragic 14.2% |
| Panamanians | 7.7 /100 | #209 | Tragic 14.2% |
| Malaysians | 7.4 /100 | #210 | Tragic 14.3% |
| Moroccans | 7.2 /100 | #211 | Tragic 14.3% |
| Bermudans | 5.5 /100 | #212 | Tragic 14.4% |
Demographics Similar to Immigrants from Caribbean by Female Poverty
In terms of female poverty, the demographic groups most similar to Immigrants from Caribbean are Seminole (16.9%, a difference of 0.12%), African (16.9%, a difference of 0.19%), Immigrants from Central America (16.8%, a difference of 0.27%), Immigrants from Grenada (16.8%, a difference of 0.27%), and Choctaw (16.8%, a difference of 0.33%).
| Demographics | Rating | Rank | Female Poverty |
| Hispanics or Latinos | 0.0 /100 | #299 | Tragic 16.6% |
| Bahamians | 0.0 /100 | #300 | Tragic 16.6% |
| Guatemalans | 0.0 /100 | #301 | Tragic 16.7% |
| Chippewa | 0.0 /100 | #302 | Tragic 16.7% |
| Choctaw | 0.0 /100 | #303 | Tragic 16.8% |
| Immigrants | Central America | 0.0 /100 | #304 | Tragic 16.8% |
| Immigrants | Grenada | 0.0 /100 | #305 | Tragic 16.8% |
| Immigrants | Caribbean | 0.0 /100 | #306 | Tragic 16.9% |
| Seminole | 0.0 /100 | #307 | Tragic 16.9% |
| Africans | 0.0 /100 | #308 | Tragic 16.9% |
| Immigrants | Mexico | 0.0 /100 | #309 | Tragic 17.0% |
| Creek | 0.0 /100 | #310 | Tragic 17.0% |
| Immigrants | Guatemala | 0.0 /100 | #311 | Tragic 17.0% |
| Immigrants | Somalia | 0.0 /100 | #312 | Tragic 17.0% |
| British West Indians | 0.0 /100 | #313 | Tragic 17.0% |