Tohono O'odham vs Ottawa Female Poverty
COMPARE
Tohono O'odham
Ottawa
Female Poverty
Female Poverty Comparison
Tohono O'odham
Ottawa
25.9%
FEMALE POVERTY
0.0/ 100
METRIC RATING
347th/ 347
METRIC RANK
15.5%
FEMALE POVERTY
0.2/ 100
METRIC RATING
255th/ 347
METRIC RANK
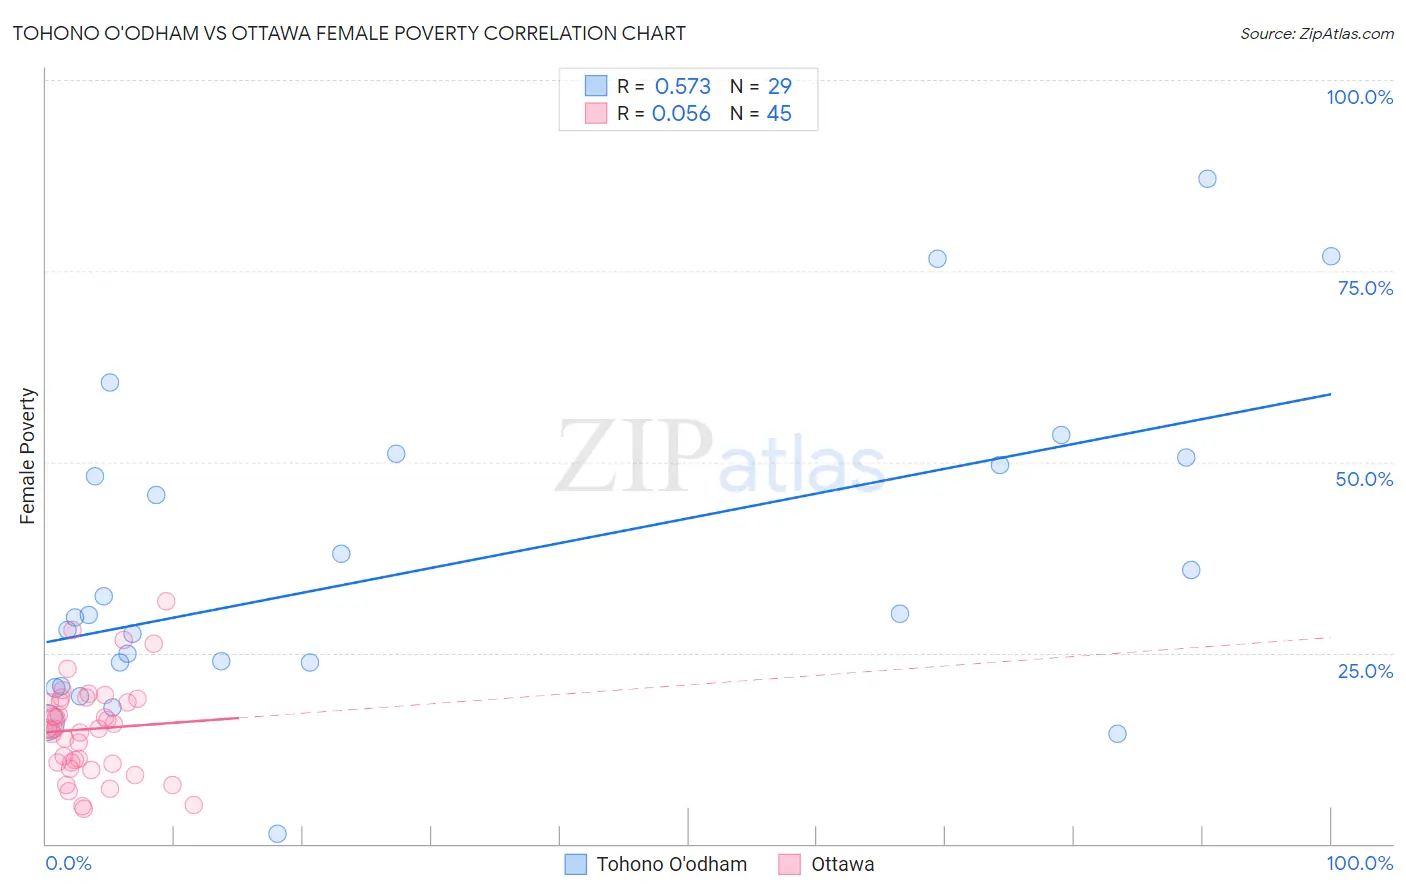
Tohono O'odham vs Ottawa Female Poverty Correlation Chart
The statistical analysis conducted on geographies consisting of 58,715,136 people shows a substantial positive correlation between the proportion of Tohono O'odham and poverty level among females in the United States with a correlation coefficient (R) of 0.573 and weighted average of 25.9%. Similarly, the statistical analysis conducted on geographies consisting of 49,943,678 people shows a slight positive correlation between the proportion of Ottawa and poverty level among females in the United States with a correlation coefficient (R) of 0.056 and weighted average of 15.5%, a difference of 67.5%.
Female Poverty Correlation Summary
| Measurement | Tohono O'odham | Ottawa |
| Minimum | 1.4% | 4.6% |
| Maximum | 87.1% | 31.7% |
| Range | 85.7% | 27.1% |
| Mean | 36.5% | 15.0% |
| Median | 30.0% | 15.0% |
| Interquartile 25% (IQ1) | 22.2% | 10.5% |
| Interquartile 75% (IQ3) | 50.0% | 18.9% |
| Interquartile Range (IQR) | 27.9% | 8.3% |
| Standard Deviation (Sample) | 20.4% | 6.2% |
| Standard Deviation (Population) | 20.1% | 6.1% |
Similar Demographics by Female Poverty
Demographics Similar to Tohono O'odham by Female Poverty
In terms of female poverty, the demographic groups most similar to Tohono O'odham are Puerto Rican (25.2%, a difference of 3.0%), Navajo (23.9%, a difference of 8.6%), Pima (23.6%, a difference of 10.0%), Lumbee (23.5%, a difference of 10.3%), and Immigrants from Yemen (22.8%, a difference of 13.6%).
| Demographics | Rating | Rank | Female Poverty |
| Immigrants | Dominican Republic | 0.0 /100 | #333 | Tragic 19.3% |
| Houma | 0.0 /100 | #334 | Tragic 20.0% |
| Cheyenne | 0.0 /100 | #335 | Tragic 20.2% |
| Pueblo | 0.0 /100 | #336 | Tragic 20.7% |
| Yuman | 0.0 /100 | #337 | Tragic 20.8% |
| Sioux | 0.0 /100 | #338 | Tragic 20.9% |
| Hopi | 0.0 /100 | #339 | Tragic 21.0% |
| Yup'ik | 0.0 /100 | #340 | Tragic 21.5% |
| Crow | 0.0 /100 | #341 | Tragic 22.1% |
| Immigrants | Yemen | 0.0 /100 | #342 | Tragic 22.8% |
| Lumbee | 0.0 /100 | #343 | Tragic 23.5% |
| Pima | 0.0 /100 | #344 | Tragic 23.6% |
| Navajo | 0.0 /100 | #345 | Tragic 23.9% |
| Puerto Ricans | 0.0 /100 | #346 | Tragic 25.2% |
| Tohono O'odham | 0.0 /100 | #347 | Tragic 25.9% |
Demographics Similar to Ottawa by Female Poverty
In terms of female poverty, the demographic groups most similar to Ottawa are Jamaican (15.5%, a difference of 0.30%), Trinidadian and Tobagonian (15.4%, a difference of 0.31%), Immigrants from Jamaica (15.6%, a difference of 0.43%), Shoshone (15.6%, a difference of 0.49%), and Liberian (15.4%, a difference of 0.54%).
| Demographics | Rating | Rank | Female Poverty |
| Immigrants | Ghana | 0.3 /100 | #248 | Tragic 15.3% |
| Salvadorans | 0.3 /100 | #249 | Tragic 15.3% |
| Immigrants | Western Africa | 0.3 /100 | #250 | Tragic 15.3% |
| Immigrants | Trinidad and Tobago | 0.3 /100 | #251 | Tragic 15.4% |
| Immigrants | Burma/Myanmar | 0.3 /100 | #252 | Tragic 15.4% |
| Liberians | 0.2 /100 | #253 | Tragic 15.4% |
| Trinidadians and Tobagonians | 0.2 /100 | #254 | Tragic 15.4% |
| Ottawa | 0.2 /100 | #255 | Tragic 15.5% |
| Jamaicans | 0.2 /100 | #256 | Tragic 15.5% |
| Immigrants | Jamaica | 0.1 /100 | #257 | Tragic 15.6% |
| Shoshone | 0.1 /100 | #258 | Tragic 15.6% |
| Cape Verdeans | 0.1 /100 | #259 | Tragic 15.6% |
| Immigrants | Guyana | 0.1 /100 | #260 | Tragic 15.6% |
| Guyanese | 0.1 /100 | #261 | Tragic 15.6% |
| Mexican American Indians | 0.1 /100 | #262 | Tragic 15.6% |