Immigrants from Albania vs Ottawa Female Poverty
COMPARE
Immigrants from Albania
Ottawa
Female Poverty
Female Poverty Comparison
Immigrants from Albania
Ottawa
13.3%
FEMALE POVERTY
62.4/ 100
METRIC RATING
163rd/ 347
METRIC RANK
15.5%
FEMALE POVERTY
0.2/ 100
METRIC RATING
255th/ 347
METRIC RANK
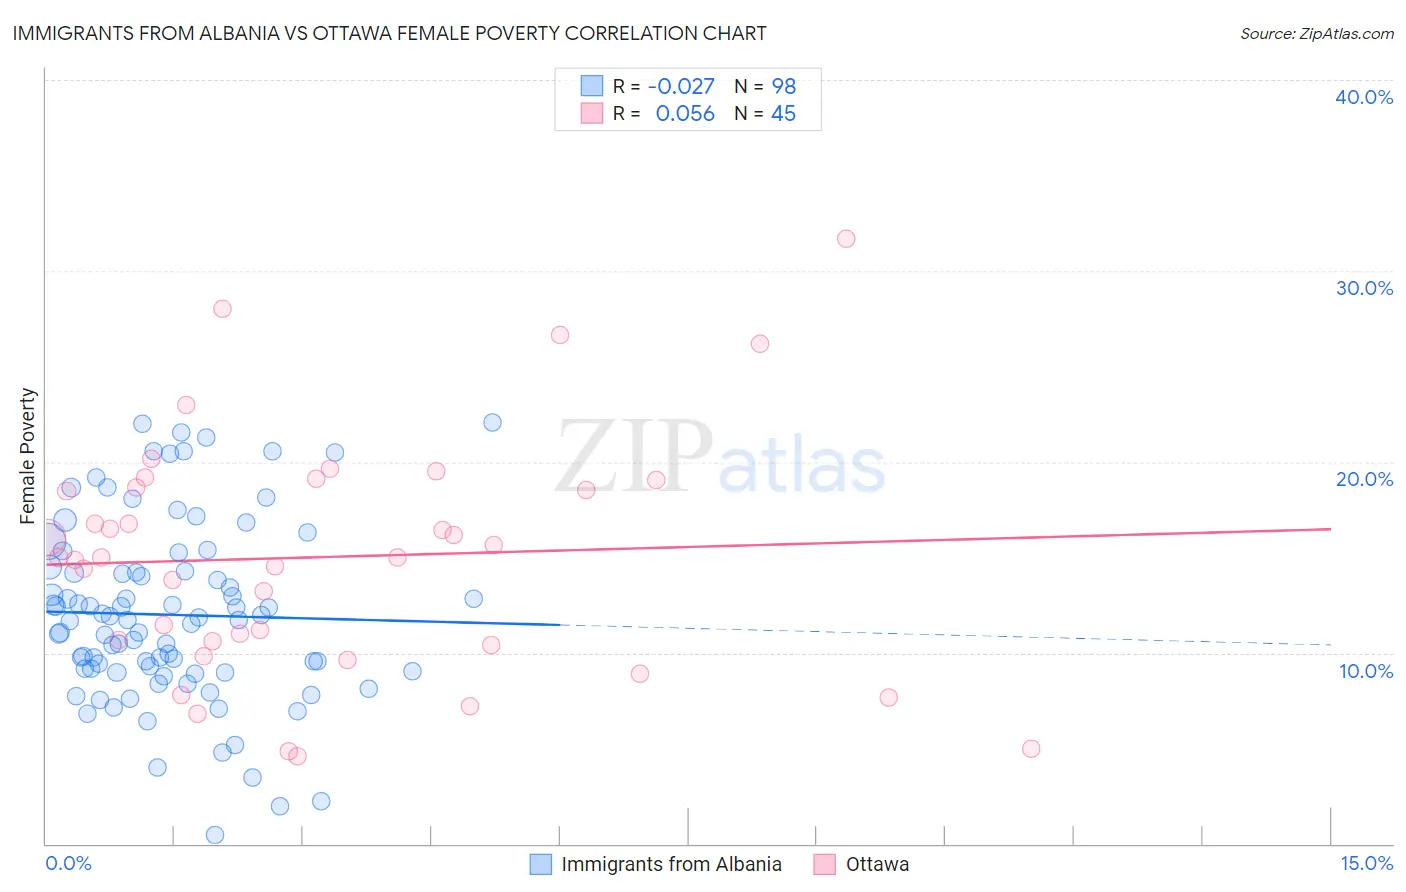
Immigrants from Albania vs Ottawa Female Poverty Correlation Chart
The statistical analysis conducted on geographies consisting of 119,347,063 people shows no correlation between the proportion of Immigrants from Albania and poverty level among females in the United States with a correlation coefficient (R) of -0.027 and weighted average of 13.3%. Similarly, the statistical analysis conducted on geographies consisting of 49,943,678 people shows a slight positive correlation between the proportion of Ottawa and poverty level among females in the United States with a correlation coefficient (R) of 0.056 and weighted average of 15.5%, a difference of 16.6%.
Female Poverty Correlation Summary
| Measurement | Immigrants from Albania | Ottawa |
| Minimum | 0.46% | 4.6% |
| Maximum | 22.1% | 31.7% |
| Range | 21.6% | 27.1% |
| Mean | 12.0% | 15.0% |
| Median | 11.7% | 15.0% |
| Interquartile 25% (IQ1) | 9.0% | 10.5% |
| Interquartile 75% (IQ3) | 14.3% | 18.9% |
| Interquartile Range (IQR) | 5.2% | 8.3% |
| Standard Deviation (Sample) | 4.7% | 6.2% |
| Standard Deviation (Population) | 4.7% | 6.1% |
Similar Demographics by Female Poverty
Demographics Similar to Immigrants from Albania by Female Poverty
In terms of female poverty, the demographic groups most similar to Immigrants from Albania are Guamanian/Chamorro (13.3%, a difference of 0.0%), Immigrants from Ethiopia (13.3%, a difference of 0.010%), Ethiopian (13.3%, a difference of 0.010%), Scotch-Irish (13.3%, a difference of 0.030%), and Immigrants from Nepal (13.3%, a difference of 0.040%).
| Demographics | Rating | Rank | Female Poverty |
| Immigrants | Bosnia and Herzegovina | 69.7 /100 | #156 | Good 13.2% |
| Immigrants | Northern Africa | 68.8 /100 | #157 | Good 13.2% |
| Pennsylvania Germans | 67.3 /100 | #158 | Good 13.2% |
| Costa Ricans | 63.6 /100 | #159 | Good 13.3% |
| Immigrants | Nepal | 62.7 /100 | #160 | Good 13.3% |
| Immigrants | Ethiopia | 62.5 /100 | #161 | Good 13.3% |
| Guamanians/Chamorros | 62.4 /100 | #162 | Good 13.3% |
| Immigrants | Albania | 62.4 /100 | #163 | Good 13.3% |
| Ethiopians | 62.3 /100 | #164 | Good 13.3% |
| Scotch-Irish | 62.1 /100 | #165 | Good 13.3% |
| Immigrants | Oceania | 59.7 /100 | #166 | Average 13.3% |
| Immigrants | Chile | 57.4 /100 | #167 | Average 13.3% |
| Aleuts | 56.7 /100 | #168 | Average 13.4% |
| Lebanese | 55.9 /100 | #169 | Average 13.4% |
| Colombians | 55.7 /100 | #170 | Average 13.4% |
Demographics Similar to Ottawa by Female Poverty
In terms of female poverty, the demographic groups most similar to Ottawa are Jamaican (15.5%, a difference of 0.30%), Trinidadian and Tobagonian (15.4%, a difference of 0.31%), Immigrants from Jamaica (15.6%, a difference of 0.43%), Shoshone (15.6%, a difference of 0.49%), and Liberian (15.4%, a difference of 0.54%).
| Demographics | Rating | Rank | Female Poverty |
| Immigrants | Ghana | 0.3 /100 | #248 | Tragic 15.3% |
| Salvadorans | 0.3 /100 | #249 | Tragic 15.3% |
| Immigrants | Western Africa | 0.3 /100 | #250 | Tragic 15.3% |
| Immigrants | Trinidad and Tobago | 0.3 /100 | #251 | Tragic 15.4% |
| Immigrants | Burma/Myanmar | 0.3 /100 | #252 | Tragic 15.4% |
| Liberians | 0.2 /100 | #253 | Tragic 15.4% |
| Trinidadians and Tobagonians | 0.2 /100 | #254 | Tragic 15.4% |
| Ottawa | 0.2 /100 | #255 | Tragic 15.5% |
| Jamaicans | 0.2 /100 | #256 | Tragic 15.5% |
| Immigrants | Jamaica | 0.1 /100 | #257 | Tragic 15.6% |
| Shoshone | 0.1 /100 | #258 | Tragic 15.6% |
| Cape Verdeans | 0.1 /100 | #259 | Tragic 15.6% |
| Immigrants | Guyana | 0.1 /100 | #260 | Tragic 15.6% |
| Guyanese | 0.1 /100 | #261 | Tragic 15.6% |
| Mexican American Indians | 0.1 /100 | #262 | Tragic 15.6% |