Tohono O'odham vs Immigrants from Armenia Female Poverty
COMPARE
Tohono O'odham
Immigrants from Armenia
Female Poverty
Female Poverty Comparison
Tohono O'odham
Immigrants from Armenia
25.9%
FEMALE POVERTY
0.0/ 100
METRIC RATING
347th/ 347
METRIC RANK
15.1%
FEMALE POVERTY
0.6/ 100
METRIC RATING
238th/ 347
METRIC RANK
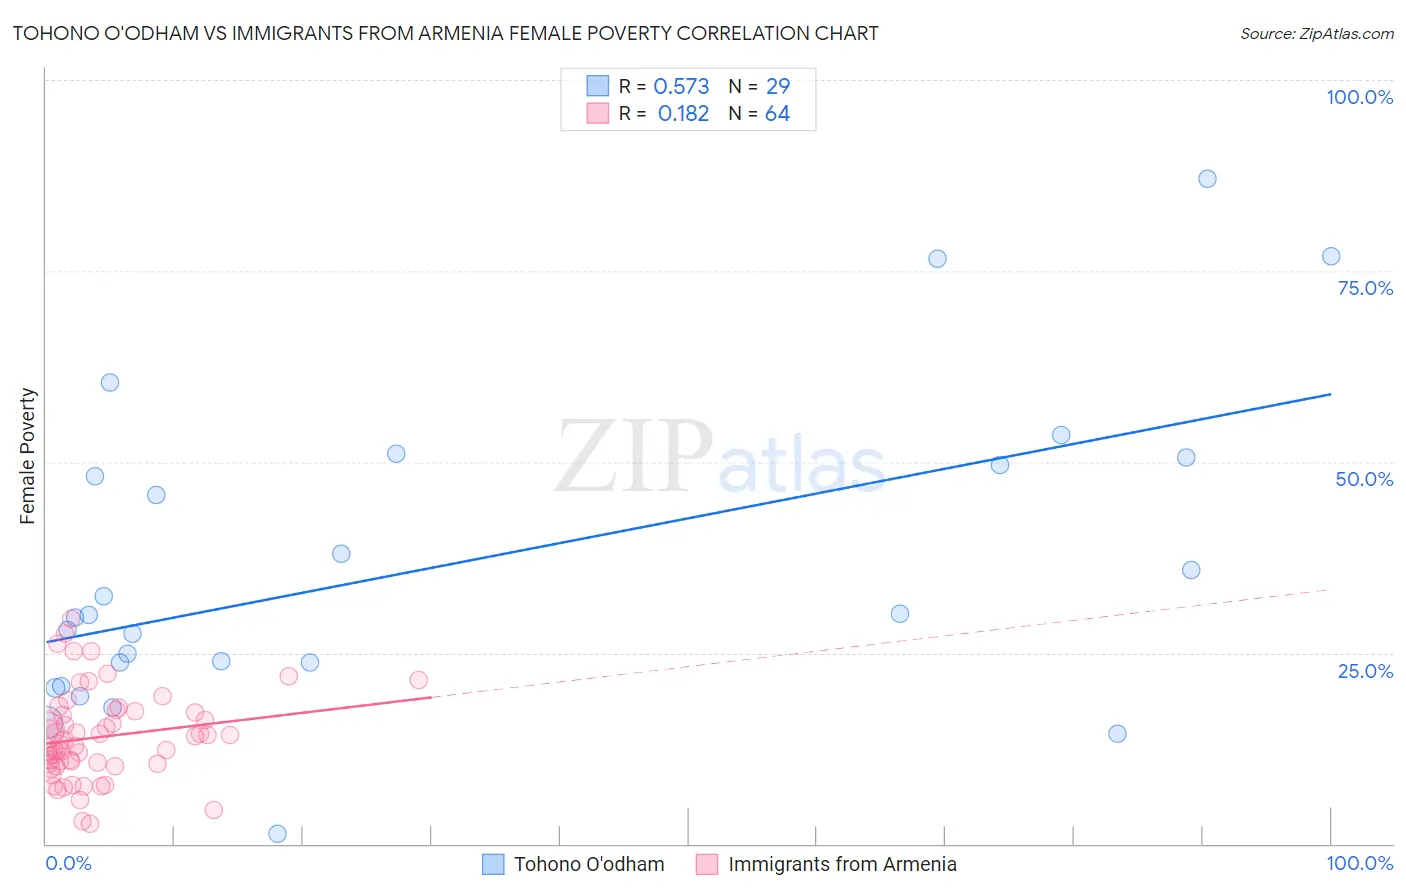
Tohono O'odham vs Immigrants from Armenia Female Poverty Correlation Chart
The statistical analysis conducted on geographies consisting of 58,715,136 people shows a substantial positive correlation between the proportion of Tohono O'odham and poverty level among females in the United States with a correlation coefficient (R) of 0.573 and weighted average of 25.9%. Similarly, the statistical analysis conducted on geographies consisting of 97,710,578 people shows a poor positive correlation between the proportion of Immigrants from Armenia and poverty level among females in the United States with a correlation coefficient (R) of 0.182 and weighted average of 15.1%, a difference of 71.8%.
Female Poverty Correlation Summary
| Measurement | Tohono O'odham | Immigrants from Armenia |
| Minimum | 1.4% | 2.5% |
| Maximum | 87.1% | 29.5% |
| Range | 85.7% | 26.9% |
| Mean | 36.5% | 14.0% |
| Median | 30.0% | 13.4% |
| Interquartile 25% (IQ1) | 22.2% | 10.5% |
| Interquartile 75% (IQ3) | 50.0% | 17.3% |
| Interquartile Range (IQR) | 27.9% | 6.7% |
| Standard Deviation (Sample) | 20.4% | 5.8% |
| Standard Deviation (Population) | 20.1% | 5.8% |
Similar Demographics by Female Poverty
Demographics Similar to Tohono O'odham by Female Poverty
In terms of female poverty, the demographic groups most similar to Tohono O'odham are Puerto Rican (25.2%, a difference of 3.0%), Navajo (23.9%, a difference of 8.6%), Pima (23.6%, a difference of 10.0%), Lumbee (23.5%, a difference of 10.3%), and Immigrants from Yemen (22.8%, a difference of 13.6%).
| Demographics | Rating | Rank | Female Poverty |
| Immigrants | Dominican Republic | 0.0 /100 | #333 | Tragic 19.3% |
| Houma | 0.0 /100 | #334 | Tragic 20.0% |
| Cheyenne | 0.0 /100 | #335 | Tragic 20.2% |
| Pueblo | 0.0 /100 | #336 | Tragic 20.7% |
| Yuman | 0.0 /100 | #337 | Tragic 20.8% |
| Sioux | 0.0 /100 | #338 | Tragic 20.9% |
| Hopi | 0.0 /100 | #339 | Tragic 21.0% |
| Yup'ik | 0.0 /100 | #340 | Tragic 21.5% |
| Crow | 0.0 /100 | #341 | Tragic 22.1% |
| Immigrants | Yemen | 0.0 /100 | #342 | Tragic 22.8% |
| Lumbee | 0.0 /100 | #343 | Tragic 23.5% |
| Pima | 0.0 /100 | #344 | Tragic 23.6% |
| Navajo | 0.0 /100 | #345 | Tragic 23.9% |
| Puerto Ricans | 0.0 /100 | #346 | Tragic 25.2% |
| Tohono O'odham | 0.0 /100 | #347 | Tragic 25.9% |
Demographics Similar to Immigrants from Armenia by Female Poverty
In terms of female poverty, the demographic groups most similar to Immigrants from Armenia are French American Indian (15.1%, a difference of 0.080%), Cree (15.1%, a difference of 0.26%), Immigrants from Middle Africa (15.2%, a difference of 0.52%), Sudanese (15.2%, a difference of 0.57%), and Immigrants from Sudan (15.2%, a difference of 0.82%).
| Demographics | Rating | Rank | Female Poverty |
| Nigerians | 1.7 /100 | #231 | Tragic 14.8% |
| Osage | 1.5 /100 | #232 | Tragic 14.8% |
| Immigrants | Saudi Arabia | 1.4 /100 | #233 | Tragic 14.8% |
| Fijians | 1.1 /100 | #234 | Tragic 14.9% |
| Immigrants | Laos | 0.9 /100 | #235 | Tragic 15.0% |
| Cree | 0.7 /100 | #236 | Tragic 15.1% |
| French American Indians | 0.6 /100 | #237 | Tragic 15.1% |
| Immigrants | Armenia | 0.6 /100 | #238 | Tragic 15.1% |
| Immigrants | Middle Africa | 0.5 /100 | #239 | Tragic 15.2% |
| Sudanese | 0.5 /100 | #240 | Tragic 15.2% |
| Immigrants | Sudan | 0.4 /100 | #241 | Tragic 15.2% |
| Nepalese | 0.4 /100 | #242 | Tragic 15.2% |
| Nicaraguans | 0.3 /100 | #243 | Tragic 15.3% |
| Ecuadorians | 0.3 /100 | #244 | Tragic 15.3% |
| Spanish American Indians | 0.3 /100 | #245 | Tragic 15.3% |