Peruvian vs Ottawa Female Poverty
COMPARE
Peruvian
Ottawa
Female Poverty
Female Poverty Comparison
Peruvians
Ottawa
12.9%
FEMALE POVERTY
85.2/ 100
METRIC RATING
136th/ 347
METRIC RANK
15.5%
FEMALE POVERTY
0.2/ 100
METRIC RATING
255th/ 347
METRIC RANK
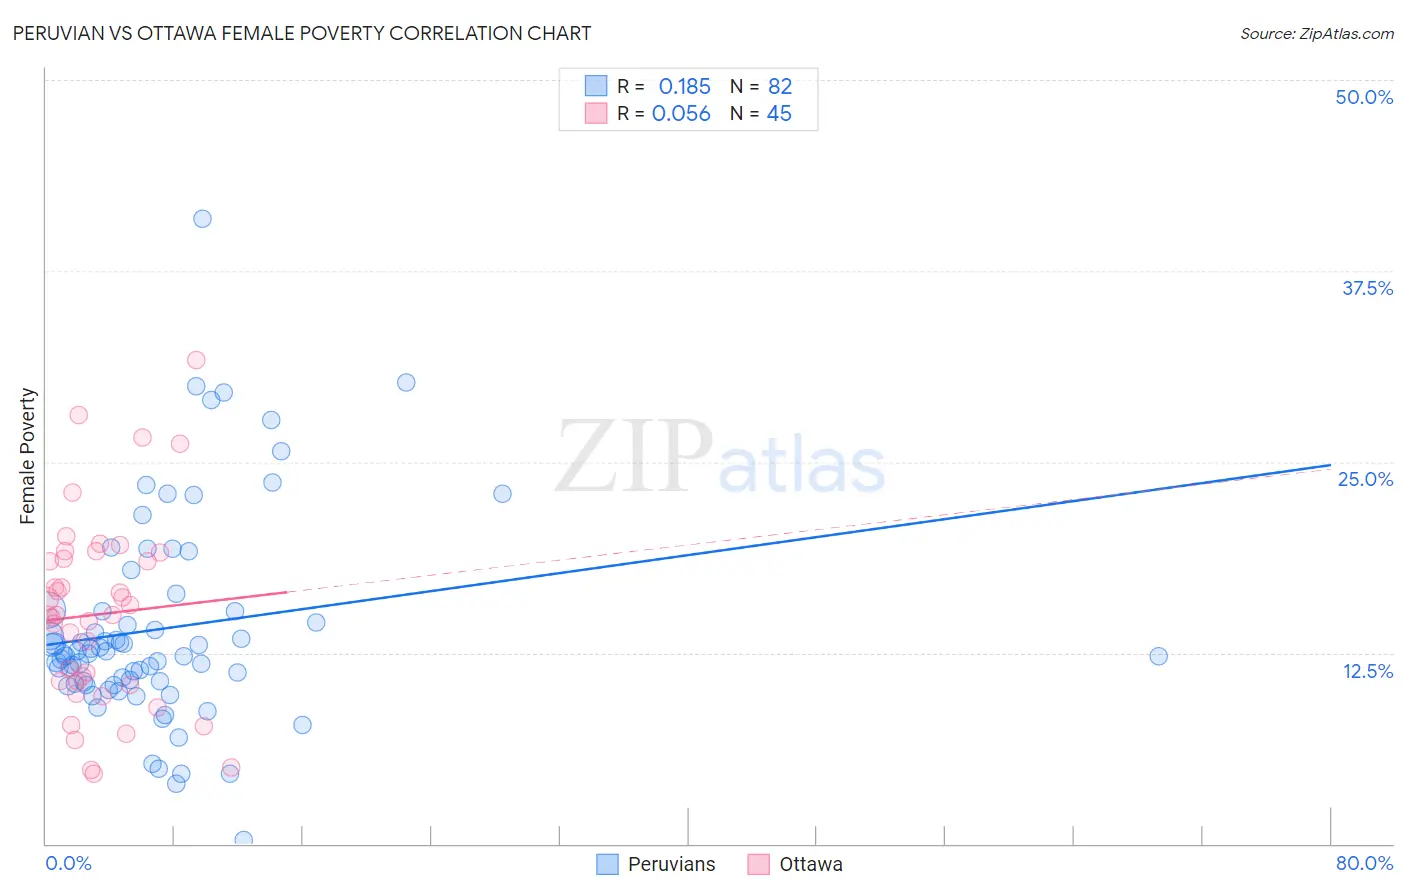
Peruvian vs Ottawa Female Poverty Correlation Chart
The statistical analysis conducted on geographies consisting of 362,941,638 people shows a poor positive correlation between the proportion of Peruvians and poverty level among females in the United States with a correlation coefficient (R) of 0.185 and weighted average of 12.9%. Similarly, the statistical analysis conducted on geographies consisting of 49,943,678 people shows a slight positive correlation between the proportion of Ottawa and poverty level among females in the United States with a correlation coefficient (R) of 0.056 and weighted average of 15.5%, a difference of 20.3%.
Female Poverty Correlation Summary
| Measurement | Peruvian | Ottawa |
| Minimum | 0.21% | 4.6% |
| Maximum | 40.9% | 31.7% |
| Range | 40.7% | 27.1% |
| Mean | 14.1% | 15.0% |
| Median | 12.5% | 15.0% |
| Interquartile 25% (IQ1) | 10.5% | 10.5% |
| Interquartile 75% (IQ3) | 15.2% | 18.9% |
| Interquartile Range (IQR) | 4.8% | 8.3% |
| Standard Deviation (Sample) | 6.8% | 6.2% |
| Standard Deviation (Population) | 6.8% | 6.1% |
Similar Demographics by Female Poverty
Demographics Similar to Peruvians by Female Poverty
In terms of female poverty, the demographic groups most similar to Peruvians are French (12.9%, a difference of 0.080%), Chilean (12.9%, a difference of 0.090%), Immigrants from Switzerland (12.9%, a difference of 0.13%), Immigrants from Western Europe (12.8%, a difference of 0.30%), and Immigrants from France (12.9%, a difference of 0.31%).
| Demographics | Rating | Rank | Female Poverty |
| Immigrants | Brazil | 87.9 /100 | #129 | Excellent 12.8% |
| Immigrants | Vietnam | 87.1 /100 | #130 | Excellent 12.8% |
| Immigrants | Argentina | 87.0 /100 | #131 | Excellent 12.8% |
| Immigrants | Jordan | 86.9 /100 | #132 | Excellent 12.8% |
| Immigrants | Western Europe | 86.6 /100 | #133 | Excellent 12.8% |
| Immigrants | Switzerland | 85.8 /100 | #134 | Excellent 12.9% |
| French | 85.6 /100 | #135 | Excellent 12.9% |
| Peruvians | 85.2 /100 | #136 | Excellent 12.9% |
| Chileans | 84.7 /100 | #137 | Excellent 12.9% |
| Immigrants | France | 83.6 /100 | #138 | Excellent 12.9% |
| Basques | 83.1 /100 | #139 | Excellent 12.9% |
| Pakistanis | 83.0 /100 | #140 | Excellent 12.9% |
| Icelanders | 81.1 /100 | #141 | Excellent 13.0% |
| Brazilians | 80.5 /100 | #142 | Excellent 13.0% |
| Immigrants | Malaysia | 80.4 /100 | #143 | Excellent 13.0% |
Demographics Similar to Ottawa by Female Poverty
In terms of female poverty, the demographic groups most similar to Ottawa are Jamaican (15.5%, a difference of 0.30%), Trinidadian and Tobagonian (15.4%, a difference of 0.31%), Immigrants from Jamaica (15.6%, a difference of 0.43%), Shoshone (15.6%, a difference of 0.49%), and Liberian (15.4%, a difference of 0.54%).
| Demographics | Rating | Rank | Female Poverty |
| Immigrants | Ghana | 0.3 /100 | #248 | Tragic 15.3% |
| Salvadorans | 0.3 /100 | #249 | Tragic 15.3% |
| Immigrants | Western Africa | 0.3 /100 | #250 | Tragic 15.3% |
| Immigrants | Trinidad and Tobago | 0.3 /100 | #251 | Tragic 15.4% |
| Immigrants | Burma/Myanmar | 0.3 /100 | #252 | Tragic 15.4% |
| Liberians | 0.2 /100 | #253 | Tragic 15.4% |
| Trinidadians and Tobagonians | 0.2 /100 | #254 | Tragic 15.4% |
| Ottawa | 0.2 /100 | #255 | Tragic 15.5% |
| Jamaicans | 0.2 /100 | #256 | Tragic 15.5% |
| Immigrants | Jamaica | 0.1 /100 | #257 | Tragic 15.6% |
| Shoshone | 0.1 /100 | #258 | Tragic 15.6% |
| Cape Verdeans | 0.1 /100 | #259 | Tragic 15.6% |
| Immigrants | Guyana | 0.1 /100 | #260 | Tragic 15.6% |
| Guyanese | 0.1 /100 | #261 | Tragic 15.6% |
| Mexican American Indians | 0.1 /100 | #262 | Tragic 15.6% |