South African vs Canadian Single Female Poverty

COMPARE

South African
Race
Ancestry
AfghanAfricanAlaska NativeAlaskan AthabascanAlbanianAleutAlsatianAmericanApacheArabArapahoArgentineanArmenianAssyrian/Chaldean/SyriacAustralianAustrianBahamianBangladeshiBarbadianBasqueBelgianBelizeanBermudanBhutaneseBlackfeetBolivianBrazilianBritishBritish West IndianBulgarianBurmeseCajunCambodianCape VerdeanCarpatho RusynCelticCentral AmericanCentral American IndianCherokeeCheyenneChickasawChileanChineseChippewaChoctawColombianColvilleComancheCosta RicanCreeCreekCroatianCrowCubanCypriotCzechCzechoslovakianDanishDelawareDominicanDutchDutch West IndianEastern EuropeanEcuadorianEgyptianEnglishEstonianEthiopianEuropeanFijianFilipinoFinnishFrenchFrench American IndianFrench CanadianGermanGerman RussianGhanaianGreekGuamanian/ChamorroGuatemalanGuyaneseHaitianHmongHonduranHopiHoumaHungarianIcelanderIndian (Asian)IndonesianInupiatIranianIraqiIrishIroquoisIsraeliItalianJamaicanJapaneseJordanianKenyanKiowaKoreanLaotianLatvianLebaneseLiberianLithuanianLumbeeLuxembourgerMacedonianMalaysianMalteseMarshalleseMenomineeMexicanMexican American IndianMongolianMoroccanNative HawaiianNavajoNepaleseNew ZealanderNicaraguanNigerianNorthern EuropeanNorwegianOkinawanOsageOttawaPaiutePakistaniPalestinianPanamanianParaguayanPennsylvania GermanPeruvianPimaPolishPortuguesePotawatomiPuebloPuerto RicanPuget Sound SalishRomanianRussianSalvadoranSamoanScandinavianScotch-IrishScottishSeminoleSenegaleseSerbianShoshoneSierra LeoneanSiouxSlavicSlovakSloveneSomaliSouth AfricanSouth AmericanSouth American IndianSoviet UnionSpaniardSpanishSpanish AmericanSpanish American IndianSri LankanSubsaharan AfricanSudaneseSwedishSwissSyrianTaiwaneseThaiTlingit-HaidaTohono O'OdhamTonganTrinidadian and TobagonianTsimshianTurkishU.S. Virgin IslanderUgandanUkrainianUruguayanUteVenezuelanVietnameseWelshWest IndianYakamaYaquiYugoslavianYumanYup'ikZimbabwean
Immigration
NonimmigrantsImmigrantsAfghanistanAfricaAlbaniaArgentinaArmeniaAsiaAustraliaAustriaBahamasBangladeshBarbadosBelarusBelgiumBelizeBoliviaBosnia and HerzegovinaBrazilBulgariaBurma/MyanmarCabo VerdeCambodiaCameroonCanadaCaribbeanCentral AmericaChileChinaColombiaCongoCosta RicaCroatiaCubaCzechoslovakiaDenmarkDominicaDominican RepublicEastern AfricaEastern AsiaEastern EuropeEcuadorEgyptEl SalvadorEnglandEritreaEthiopiaEuropeFijiFranceGermanyGhanaGreeceGrenadaGuatemalaGuyanaHaitiHondurasHong KongHungaryIndiaIndonesiaIranIraqIrelandIsraelItalyJamaicaJapanJordanKazakhstanKenyaKoreaKuwaitLaosLatin AmericaLatviaLebanonLiberiaLithuaniaMalaysiaMexicoMicronesiaMiddle AfricaMoldovaMoroccoNepalNetherlandsNicaraguaNigeriaNorth AmericaNorth MacedoniaNorthern AfricaNorthern EuropeNorwayOceaniaPakistanPanamaPeruPhilippinesPolandPortugalRomaniaRussiaSaudi ArabiaScotlandSenegalSerbiaSierra LeoneSingaporeSomaliaSouth AfricaSouth AmericaSouth Central AsiaSouth Eastern AsiaSouthern EuropeSpainSri LankaSt. Vincent and the GrenadinesSudanSwedenSwitzerlandSyriaTaiwanThailandTrinidad and TobagoTurkeyUgandaUkraineUruguayUzbekistanVenezuelaVietnamWest IndiesWestern AfricaWestern AsiaWestern EuropeYemenZaireZimbabweAzores
Canadian
Race
Ancestry
AfghanAfricanAlaska NativeAlaskan AthabascanAlbanianAleutAlsatianAmericanApacheArabArapahoArgentineanArmenianAssyrian/Chaldean/SyriacAustralianAustrianBahamianBangladeshiBarbadianBasqueBelgianBelizeanBermudanBhutaneseBlackfeetBolivianBrazilianBritishBritish West IndianBulgarianBurmeseCajunCambodianCanadianCape VerdeanCarpatho RusynCelticCentral AmericanCentral American IndianCherokeeCheyenneChickasawChileanChineseChippewaChoctawColombianColvilleComancheCosta RicanCreeCreekCroatianCrowCubanCypriotCzechCzechoslovakianDanishDelawareDominicanDutchDutch West IndianEastern EuropeanEcuadorianEgyptianEnglishEstonianEthiopianEuropeanFijianFilipinoFinnishFrenchFrench American IndianFrench CanadianGermanGerman RussianGhanaianGreekGuamanian/ChamorroGuatemalanGuyaneseHaitianHmongHonduranHopiHoumaHungarianIcelanderIndian (Asian)IndonesianInupiatIranianIraqiIrishIroquoisIsraeliItalianJamaicanJapaneseJordanianKenyanKiowaKoreanLaotianLatvianLebaneseLiberianLithuanianLumbeeLuxembourgerMacedonianMalaysianMalteseMarshalleseMenomineeMexicanMexican American IndianMongolianMoroccanNative HawaiianNavajoNepaleseNew ZealanderNicaraguanNigerianNorthern EuropeanNorwegianOkinawanOsageOttawaPaiutePakistaniPalestinianPanamanianParaguayanPennsylvania GermanPeruvianPimaPolishPortuguesePotawatomiPuebloPuerto RicanPuget Sound SalishRomanianRussianSalvadoranSamoanScandinavianScotch-IrishScottishSeminoleSenegaleseSerbianShoshoneSierra LeoneanSiouxSlavicSlovakSloveneSomaliSouth AmericanSouth American IndianSoviet UnionSpaniardSpanishSpanish AmericanSpanish American IndianSri LankanSubsaharan AfricanSudaneseSwedishSwissSyrianTaiwaneseThaiTlingit-HaidaTohono O'OdhamTonganTrinidadian and TobagonianTsimshianTurkishU.S. Virgin IslanderUgandanUkrainianUruguayanUteVenezuelanVietnameseWelshWest IndianYakamaYaquiYugoslavianYumanYup'ikZimbabwean
Immigration
NonimmigrantsImmigrantsAfghanistanAfricaAlbaniaArgentinaArmeniaAsiaAustraliaAustriaBahamasBangladeshBarbadosBelarusBelgiumBelizeBoliviaBosnia and HerzegovinaBrazilBulgariaBurma/MyanmarCabo VerdeCambodiaCameroonCanadaCaribbeanCentral AmericaChileChinaColombiaCongoCosta RicaCroatiaCubaCzechoslovakiaDenmarkDominicaDominican RepublicEastern AfricaEastern AsiaEastern EuropeEcuadorEgyptEl SalvadorEnglandEritreaEthiopiaEuropeFijiFranceGermanyGhanaGreeceGrenadaGuatemalaGuyanaHaitiHondurasHong KongHungaryIndiaIndonesiaIranIraqIrelandIsraelItalyJamaicaJapanJordanKazakhstanKenyaKoreaKuwaitLaosLatin AmericaLatviaLebanonLiberiaLithuaniaMalaysiaMexicoMicronesiaMiddle AfricaMoldovaMoroccoNepalNetherlandsNicaraguaNigeriaNorth AmericaNorth MacedoniaNorthern AfricaNorthern EuropeNorwayOceaniaPakistanPanamaPeruPhilippinesPolandPortugalRomaniaRussiaSaudi ArabiaScotlandSenegalSerbiaSierra LeoneSingaporeSomaliaSouth AfricaSouth AmericaSouth Central AsiaSouth Eastern AsiaSouthern EuropeSpainSri LankaSt. Vincent and the GrenadinesSudanSwedenSwitzerlandSyriaTaiwanThailandTrinidad and TobagoTurkeyUgandaUkraineUruguayUzbekistanVenezuelaVietnamWest IndiesWestern AfricaWestern AsiaWestern EuropeYemenZaireZimbabweAzores
Single Female Poverty
Income
Poverty
Unemployment
Labor Participation
Family Structure
Vehicle Availability
Education Level
Disability

Single Female Poverty Comparison

South Africans

Canadians

Excellent
Average
20.4%
SINGLE FEMALE POVERTY
85.3/ 100
METRIC RATING
147th/ 347
METRIC RANK
21.1%
SINGLE FEMALE POVERTY
45.4/ 100
METRIC RATING
176th/ 347
METRIC RANK

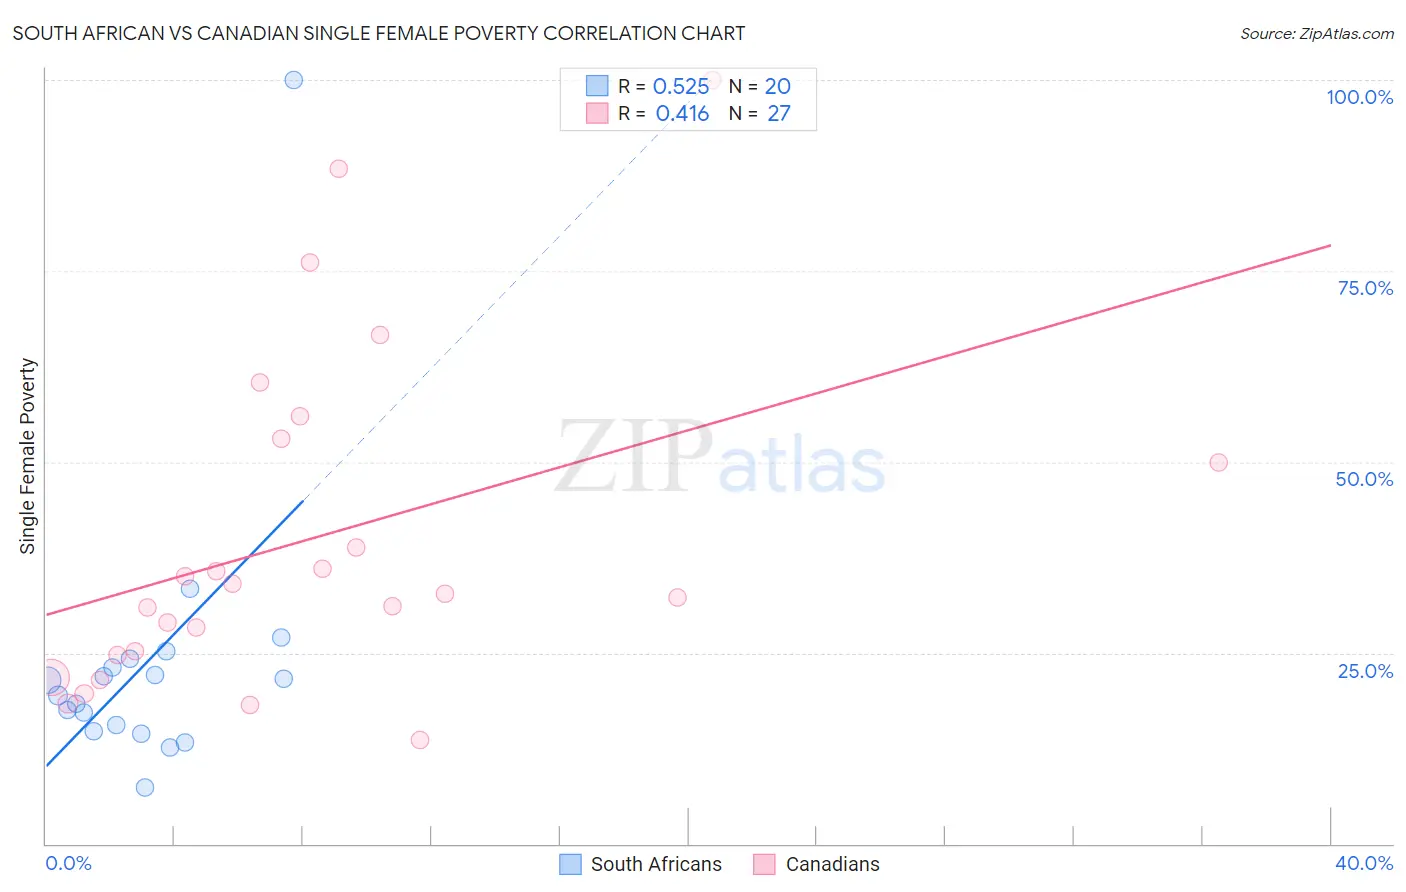
South African vs Canadian Single Female Poverty Correlation Chart

The statistical analysis conducted on geographies consisting of 180,862,310 people shows a substantial positive correlation between the proportion of South Africans and poverty level among single females in the United States with a correlation coefficient (R) of 0.525 and weighted average of 20.4%. Similarly, the statistical analysis conducted on geographies consisting of 428,352,495 people shows a moderate positive correlation between the proportion of Canadians and poverty level among single females in the United States with a correlation coefficient (R) of 0.416 and weighted average of 21.1%, a difference of 3.1%.
South African vs Canadian Single Female Poverty

Single Female Poverty Correlation Summary

MeasurementSouth AfricanCanadian
Minimum7.4%13.6%
Maximum100.0%100.0%
Range92.6%86.4%
Mean23.5%39.9%
Median20.4%32.8%
Interquartile 25% (IQ1)15.2%24.7%
Interquartile 75% (IQ3)23.6%53.0%
Interquartile Range (IQR)8.4%28.3%
Standard Deviation (Sample)18.9%22.1%
Standard Deviation (Population)18.4%21.7%

Similar Demographics by Single Female Poverty

Demographics Similar to South Africans by Single Female Poverty

In terms of single female poverty, the demographic groups most similar to South Africans are Venezuelan (20.4%, a difference of 0.030%), Luxembourger (20.4%, a difference of 0.050%), Austrian (20.4%, a difference of 0.060%), Immigrants from Uzbekistan (20.3%, a difference of 0.42%), and Australian (20.3%, a difference of 0.43%).
DemographicsRating | RankSingle Female Poverty
Syrians
90.4
/100
|
#140
Exceptional
20.3%
Immigrants | North America
89.5
/100
|
#141
Excellent
20.3%
Immigrants | Uganda
89.1
/100
|
#142
Excellent
20.3%
Australians
88.4
/100
|
#143
Excellent
20.3%
Immigrants | Uzbekistan
88.3
/100
|
#144
Excellent
20.3%
Austrians
85.8
/100
|
#145
Excellent
20.4%
Venezuelans
85.5
/100
|
#146
Excellent
20.4%
South Africans
85.3
/100
|
#147
Excellent
20.4%
Luxembourgers
84.9
/100
|
#148
Excellent
20.4%
Portuguese
81.5
/100
|
#149
Excellent
20.5%
Immigrants | Denmark
80.5
/100
|
#150
Excellent
20.5%
Puget Sound Salish
79.6
/100
|
#151
Good
20.6%
Immigrants | Uruguay
77.7
/100
|
#152
Good
20.6%
Swedes
77.1
/100
|
#153
Good
20.6%
Immigrants | Western Europe
76.7
/100
|
#154
Good
20.6%

Demographics Similar to Canadians by Single Female Poverty

In terms of single female poverty, the demographic groups most similar to Canadians are Scandinavian (21.1%, a difference of 0.010%), Immigrants from Bosnia and Herzegovina (21.1%, a difference of 0.040%), Czech (21.0%, a difference of 0.080%), British (21.1%, a difference of 0.16%), and Spanish American Indian (21.1%, a difference of 0.19%).
DemographicsRating | RankSingle Female Poverty
Immigrants | Trinidad and Tobago
56.3
/100
|
#169
Average
20.9%
New Zealanders
53.2
/100
|
#170
Average
21.0%
Moroccans
52.8
/100
|
#171
Average
21.0%
Guyanese
52.0
/100
|
#172
Average
21.0%
Immigrants | Guyana
50.6
/100
|
#173
Average
21.0%
Cubans
50.0
/100
|
#174
Average
21.0%
Czechs
46.8
/100
|
#175
Average
21.0%
Canadians
45.4
/100
|
#176
Average
21.1%
Scandinavians
45.2
/100
|
#177
Average
21.1%
Immigrants | Bosnia and Herzegovina
44.9
/100
|
#178
Average
21.1%
British
42.9
/100
|
#179
Average
21.1%
Spanish American Indians
42.5
/100
|
#180
Average
21.1%
Europeans
42.3
/100
|
#181
Average
21.1%
Slavs
40.5
/100
|
#182
Average
21.1%
Slovaks
39.7
/100
|
#183
Fair
21.1%