Maltese vs Immigrants from Sweden Single Mother Poverty
COMPARE
Maltese
Immigrants from Sweden
Single Mother Poverty
Single Mother Poverty Comparison
Maltese
Immigrants from Sweden
26.6%
SINGLE MOTHER POVERTY
99.9/ 100
METRIC RATING
35th/ 347
METRIC RANK
27.5%
SINGLE MOTHER POVERTY
99.2/ 100
METRIC RATING
75th/ 347
METRIC RANK
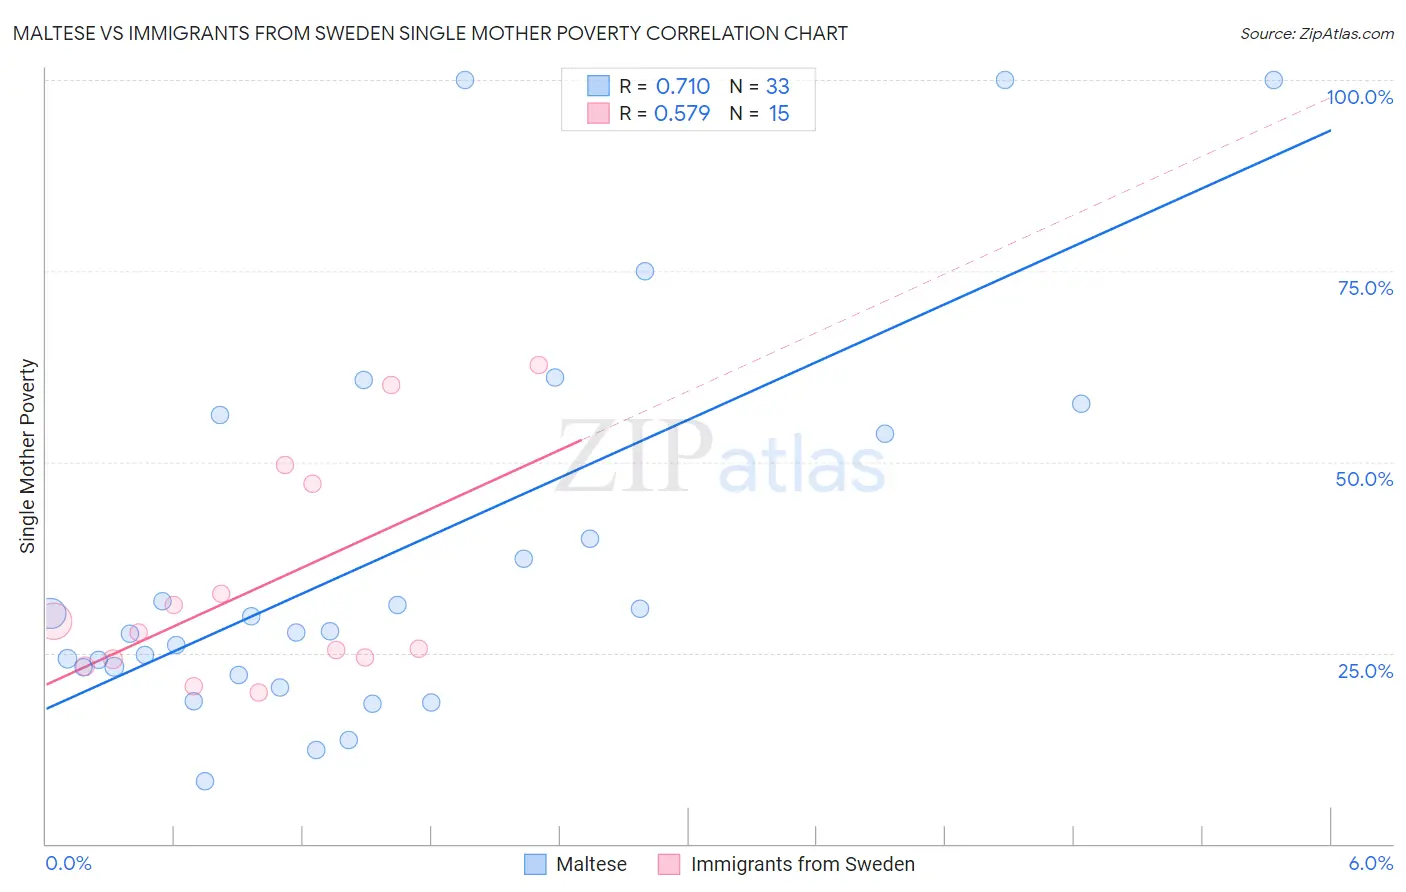
Maltese vs Immigrants from Sweden Single Mother Poverty Correlation Chart
The statistical analysis conducted on geographies consisting of 124,400,291 people shows a strong positive correlation between the proportion of Maltese and poverty level among single mothers in the United States with a correlation coefficient (R) of 0.710 and weighted average of 26.6%. Similarly, the statistical analysis conducted on geographies consisting of 161,889,555 people shows a substantial positive correlation between the proportion of Immigrants from Sweden and poverty level among single mothers in the United States with a correlation coefficient (R) of 0.579 and weighted average of 27.5%, a difference of 3.4%.
Single Mother Poverty Correlation Summary
| Measurement | Maltese | Immigrants from Sweden |
| Minimum | 8.2% | 19.8% |
| Maximum | 100.0% | 62.7% |
| Range | 91.8% | 42.9% |
| Mean | 38.1% | 33.6% |
| Median | 27.8% | 27.7% |
| Interquartile 25% (IQ1) | 22.6% | 24.2% |
| Interquartile 75% (IQ3) | 54.9% | 47.2% |
| Interquartile Range (IQR) | 32.3% | 23.0% |
| Standard Deviation (Sample) | 25.3% | 14.2% |
| Standard Deviation (Population) | 24.9% | 13.7% |
Similar Demographics by Single Mother Poverty
Demographics Similar to Maltese by Single Mother Poverty
In terms of single mother poverty, the demographic groups most similar to Maltese are Okinawan (26.6%, a difference of 0.050%), Immigrants from Israel (26.6%, a difference of 0.050%), Immigrants from Fiji (26.6%, a difference of 0.090%), Immigrants from Indonesia (26.6%, a difference of 0.12%), and Bulgarian (26.5%, a difference of 0.13%).
| Demographics | Rating | Rank | Single Mother Poverty |
| Koreans | 100.0 /100 | #28 | Exceptional 26.4% |
| Jordanians | 100.0 /100 | #29 | Exceptional 26.4% |
| Turks | 100.0 /100 | #30 | Exceptional 26.4% |
| Immigrants | Philippines | 100.0 /100 | #31 | Exceptional 26.5% |
| Tongans | 99.9 /100 | #32 | Exceptional 26.5% |
| Bulgarians | 99.9 /100 | #33 | Exceptional 26.5% |
| Immigrants | Indonesia | 99.9 /100 | #34 | Exceptional 26.6% |
| Maltese | 99.9 /100 | #35 | Exceptional 26.6% |
| Okinawans | 99.9 /100 | #36 | Exceptional 26.6% |
| Immigrants | Israel | 99.9 /100 | #37 | Exceptional 26.6% |
| Immigrants | Fiji | 99.9 /100 | #38 | Exceptional 26.6% |
| Sri Lankans | 99.9 /100 | #39 | Exceptional 26.7% |
| Immigrants | Vietnam | 99.9 /100 | #40 | Exceptional 26.7% |
| Immigrants | Greece | 99.9 /100 | #41 | Exceptional 26.7% |
| Armenians | 99.9 /100 | #42 | Exceptional 26.8% |
Demographics Similar to Immigrants from Sweden by Single Mother Poverty
In terms of single mother poverty, the demographic groups most similar to Immigrants from Sweden are Peruvian (27.5%, a difference of 0.040%), Immigrants from Peru (27.5%, a difference of 0.060%), Immigrants from North Macedonia (27.5%, a difference of 0.080%), Immigrants from Italy (27.5%, a difference of 0.11%), and Taiwanese (27.5%, a difference of 0.11%).
| Demographics | Rating | Rank | Single Mother Poverty |
| Immigrants | Czechoslovakia | 99.5 /100 | #68 | Exceptional 27.4% |
| Lithuanians | 99.4 /100 | #69 | Exceptional 27.4% |
| Immigrants | Belarus | 99.4 /100 | #70 | Exceptional 27.4% |
| Macedonians | 99.4 /100 | #71 | Exceptional 27.4% |
| Immigrants | Russia | 99.4 /100 | #72 | Exceptional 27.4% |
| Sierra Leoneans | 99.3 /100 | #73 | Exceptional 27.4% |
| Immigrants | Europe | 99.3 /100 | #74 | Exceptional 27.4% |
| Immigrants | Sweden | 99.2 /100 | #75 | Exceptional 27.5% |
| Peruvians | 99.2 /100 | #76 | Exceptional 27.5% |
| Immigrants | Peru | 99.2 /100 | #77 | Exceptional 27.5% |
| Immigrants | North Macedonia | 99.2 /100 | #78 | Exceptional 27.5% |
| Immigrants | Italy | 99.1 /100 | #79 | Exceptional 27.5% |
| Taiwanese | 99.1 /100 | #80 | Exceptional 27.5% |
| Immigrants | Scotland | 98.9 /100 | #81 | Exceptional 27.6% |
| Immigrants | Cameroon | 98.8 /100 | #82 | Exceptional 27.6% |