Tlingit-Haida vs Immigrants from Sweden Per Capita Income

COMPARE

Tlingit-Haida
Race
Ancestry
AfghanAfricanAlaska NativeAlaskan AthabascanAlbanianAleutAlsatianAmericanApacheArabArapahoArgentineanArmenianAssyrian/Chaldean/SyriacAustralianAustrianBahamianBangladeshiBarbadianBasqueBelgianBelizeanBermudanBhutaneseBlackfeetBolivianBrazilianBritishBritish West IndianBulgarianBurmeseCajunCambodianCanadianCape VerdeanCarpatho RusynCelticCentral AmericanCentral American IndianCherokeeCheyenneChickasawChileanChineseChippewaChoctawColombianColvilleComancheCosta RicanCreeCreekCroatianCrowCubanCypriotCzechCzechoslovakianDanishDelawareDominicanDutchDutch West IndianEastern EuropeanEcuadorianEgyptianEnglishEstonianEthiopianEuropeanFijianFilipinoFinnishFrenchFrench American IndianFrench CanadianGermanGerman RussianGhanaianGreekGuamanian/ChamorroGuatemalanGuyaneseHaitianHmongHonduranHopiHoumaHungarianIcelanderIndian (Asian)IndonesianInupiatIranianIraqiIrishIroquoisIsraeliItalianJamaicanJapaneseJordanianKenyanKiowaKoreanLaotianLatvianLebaneseLiberianLithuanianLumbeeLuxembourgerMacedonianMalaysianMalteseMarshalleseMenomineeMexicanMexican American IndianMongolianMoroccanNative HawaiianNavajoNepaleseNew ZealanderNicaraguanNigerianNorthern EuropeanNorwegianOkinawanOsageOttawaPaiutePakistaniPalestinianPanamanianParaguayanPennsylvania GermanPeruvianPimaPolishPortuguesePotawatomiPuebloPuerto RicanPuget Sound SalishRomanianRussianSalvadoranSamoanScandinavianScotch-IrishScottishSeminoleSenegaleseSerbianShoshoneSierra LeoneanSiouxSlavicSlovakSloveneSomaliSouth AfricanSouth AmericanSouth American IndianSoviet UnionSpaniardSpanishSpanish AmericanSpanish American IndianSri LankanSubsaharan AfricanSudaneseSwedishSwissSyrianTaiwaneseThaiTlingit-HaidaTohono O'OdhamTonganTrinidadian and TobagonianTsimshianTurkishU.S. Virgin IslanderUgandanUkrainianUruguayanUteVenezuelanVietnameseWelshWest IndianYakamaYaquiYugoslavianYumanYup'ikZimbabwean
Immigration
NonimmigrantsImmigrantsAfghanistanAfricaAlbaniaArgentinaArmeniaAsiaAustraliaAustriaBahamasBangladeshBarbadosBelarusBelgiumBelizeBoliviaBosnia and HerzegovinaBrazilBulgariaBurma/MyanmarCabo VerdeCambodiaCameroonCanadaCaribbeanCentral AmericaChileChinaColombiaCongoCosta RicaCroatiaCubaCzechoslovakiaDenmarkDominicaDominican RepublicEastern AfricaEastern AsiaEastern EuropeEcuadorEgyptEl SalvadorEnglandEritreaEthiopiaEuropeFijiFranceGermanyGhanaGreeceGrenadaGuatemalaGuyanaHaitiHondurasHong KongHungaryIndiaIndonesiaIranIraqIrelandIsraelItalyJamaicaJapanJordanKazakhstanKenyaKoreaKuwaitLaosLatin AmericaLatviaLebanonLiberiaLithuaniaMalaysiaMexicoMicronesiaMiddle AfricaMoldovaMoroccoNepalNetherlandsNicaraguaNigeriaNorth AmericaNorth MacedoniaNorthern AfricaNorthern EuropeNorwayOceaniaPakistanPanamaPeruPhilippinesPolandPortugalRomaniaRussiaSaudi ArabiaScotlandSenegalSerbiaSierra LeoneSingaporeSomaliaSouth AfricaSouth AmericaSouth Central AsiaSouth Eastern AsiaSouthern EuropeSpainSri LankaSt. Vincent and the GrenadinesSudanSwitzerlandSyriaTaiwanThailandTrinidad and TobagoTurkeyUgandaUkraineUruguayUzbekistanVenezuelaVietnamWest IndiesWestern AfricaWestern AsiaWestern EuropeYemenZaireZimbabweAzores
Immigrants from Sweden
Race
Ancestry
AfghanAfricanAlaska NativeAlaskan AthabascanAlbanianAleutAlsatianAmericanApacheArabArapahoArgentineanArmenianAssyrian/Chaldean/SyriacAustralianAustrianBahamianBangladeshiBarbadianBasqueBelgianBelizeanBermudanBhutaneseBlackfeetBolivianBrazilianBritishBritish West IndianBulgarianBurmeseCajunCambodianCanadianCape VerdeanCarpatho RusynCelticCentral AmericanCentral American IndianCherokeeCheyenneChickasawChileanChineseChippewaChoctawColombianColvilleComancheCosta RicanCreeCreekCroatianCrowCubanCypriotCzechCzechoslovakianDanishDelawareDominicanDutchDutch West IndianEastern EuropeanEcuadorianEgyptianEnglishEstonianEthiopianEuropeanFijianFilipinoFinnishFrenchFrench American IndianFrench CanadianGermanGerman RussianGhanaianGreekGuamanian/ChamorroGuatemalanGuyaneseHaitianHmongHonduranHopiHoumaHungarianIcelanderIndian (Asian)IndonesianInupiatIranianIraqiIrishIroquoisIsraeliItalianJamaicanJapaneseJordanianKenyanKiowaKoreanLaotianLatvianLebaneseLiberianLithuanianLumbeeLuxembourgerMacedonianMalaysianMalteseMarshalleseMenomineeMexicanMexican American IndianMongolianMoroccanNative HawaiianNavajoNepaleseNew ZealanderNicaraguanNigerianNorthern EuropeanNorwegianOkinawanOsageOttawaPaiutePakistaniPalestinianPanamanianParaguayanPennsylvania GermanPeruvianPimaPolishPortuguesePotawatomiPuebloPuerto RicanPuget Sound SalishRomanianRussianSalvadoranSamoanScandinavianScotch-IrishScottishSeminoleSenegaleseSerbianShoshoneSierra LeoneanSiouxSlavicSlovakSloveneSomaliSouth AfricanSouth AmericanSouth American IndianSoviet UnionSpaniardSpanishSpanish AmericanSpanish American IndianSri LankanSubsaharan AfricanSudaneseSwedishSwissSyrianTaiwaneseThaiTohono O'OdhamTonganTrinidadian and TobagonianTsimshianTurkishU.S. Virgin IslanderUgandanUkrainianUruguayanUteVenezuelanVietnameseWelshWest IndianYakamaYaquiYugoslavianYumanYup'ikZimbabwean
Immigration
NonimmigrantsImmigrantsAfghanistanAfricaAlbaniaArgentinaArmeniaAsiaAustraliaAustriaBahamasBangladeshBarbadosBelarusBelgiumBelizeBoliviaBosnia and HerzegovinaBrazilBulgariaBurma/MyanmarCabo VerdeCambodiaCameroonCanadaCaribbeanCentral AmericaChileChinaColombiaCongoCosta RicaCroatiaCubaCzechoslovakiaDenmarkDominicaDominican RepublicEastern AfricaEastern AsiaEastern EuropeEcuadorEgyptEl SalvadorEnglandEritreaEthiopiaEuropeFijiFranceGermanyGhanaGreeceGrenadaGuatemalaGuyanaHaitiHondurasHong KongHungaryIndiaIndonesiaIranIraqIrelandIsraelItalyJamaicaJapanJordanKazakhstanKenyaKoreaKuwaitLaosLatin AmericaLatviaLebanonLiberiaLithuaniaMalaysiaMexicoMicronesiaMiddle AfricaMoldovaMoroccoNepalNetherlandsNicaraguaNigeriaNorth AmericaNorth MacedoniaNorthern AfricaNorthern EuropeNorwayOceaniaPakistanPanamaPeruPhilippinesPolandPortugalRomaniaRussiaSaudi ArabiaScotlandSenegalSerbiaSierra LeoneSingaporeSomaliaSouth AfricaSouth AmericaSouth Central AsiaSouth Eastern AsiaSouthern EuropeSpainSri LankaSt. Vincent and the GrenadinesSudanSwedenSwitzerlandSyriaTaiwanThailandTrinidad and TobagoTurkeyUgandaUkraineUruguayUzbekistanVenezuelaVietnamWest IndiesWestern AfricaWestern AsiaWestern EuropeYemenZaireZimbabweAzores
Per Capita Income
Income
Poverty
Unemployment
Labor Participation
Family Structure
Vehicle Availability
Education Level
Disability

Per Capita Income Comparison

Tlingit-Haida

Immigrants from Sweden

Average
Exceptional
$43,516
PER CAPITA INCOME
45.9/ 100
METRIC RATING
177th/ 347
METRIC RANK
$55,582
PER CAPITA INCOME
100.0/ 100
METRIC RATING
12th/ 347
METRIC RANK

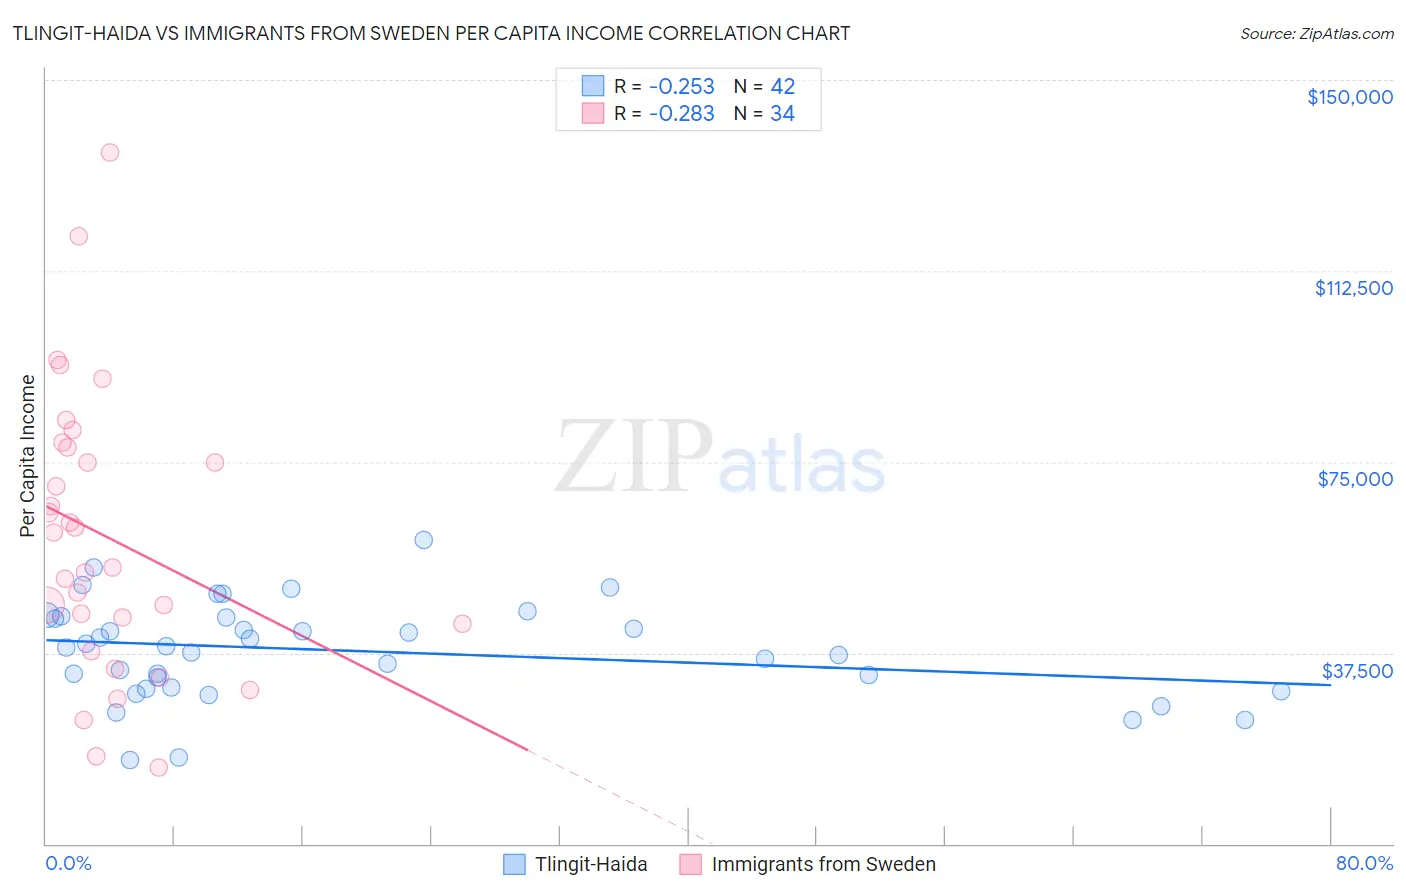
Tlingit-Haida vs Immigrants from Sweden Per Capita Income Correlation Chart

The statistical analysis conducted on geographies consisting of 60,872,339 people shows a weak negative correlation between the proportion of Tlingit-Haida and per capita income in the United States with a correlation coefficient (R) of -0.253 and weighted average of $43,516. Similarly, the statistical analysis conducted on geographies consisting of 164,749,853 people shows a weak negative correlation between the proportion of Immigrants from Sweden and per capita income in the United States with a correlation coefficient (R) of -0.283 and weighted average of $55,582, a difference of 27.7%.
Tlingit-Haida vs Immigrants from Sweden Per Capita Income

Per Capita Income Correlation Summary

MeasurementTlingit-HaidaImmigrants from Sweden
Minimum$16,326$15,015
Maximum$59,619$135,828
Range$43,293$120,813
Mean$37,894$60,294
Median$38,682$57,777
Interquartile 25% (IQ1)$30,599$43,188
Interquartile 75% (IQ3)$44,372$77,916
Interquartile Range (IQR)$13,773$34,728
Standard Deviation (Sample)$9,586$27,626
Standard Deviation (Population)$9,471$27,217

Similar Demographics by Per Capita Income

Demographics Similar to Tlingit-Haida by Per Capita Income

In terms of per capita income, the demographic groups most similar to Tlingit-Haida are Immigrants from South Eastern Asia ($43,539, a difference of 0.050%), Immigrants from Costa Rica ($43,464, a difference of 0.12%), Finnish ($43,461, a difference of 0.13%), Celtic ($43,621, a difference of 0.24%), and Sierra Leonean ($43,405, a difference of 0.25%).
DemographicsRating | RankPer Capita Income
Scandinavians
55.2
/100
|
#170
Average
$43,848
Immigrants | Eastern Africa
54.9
/100
|
#171
Average
$43,838
Czechoslovakians
54.1
/100
|
#172
Average
$43,806
French
50.7
/100
|
#173
Average
$43,685
Colombians
50.0
/100
|
#174
Average
$43,661
Celtics
48.9
/100
|
#175
Average
$43,621
Immigrants | South Eastern Asia
46.6
/100
|
#176
Average
$43,539
Tlingit-Haida
45.9
/100
|
#177
Average
$43,516
Immigrants | Costa Rica
44.5
/100
|
#178
Average
$43,464
Finns
44.4
/100
|
#179
Average
$43,461
Sierra Leoneans
42.9
/100
|
#180
Average
$43,405
Welsh
38.2
/100
|
#181
Fair
$43,233
Immigrants | Vietnam
38.1
/100
|
#182
Fair
$43,229
Germans
33.9
/100
|
#183
Fair
$43,067
Spaniards
32.9
/100
|
#184
Fair
$43,028

Demographics Similar to Immigrants from Sweden by Per Capita Income

In terms of per capita income, the demographic groups most similar to Immigrants from Sweden are Eastern European ($55,780, a difference of 0.36%), Okinawan ($55,817, a difference of 0.42%), Immigrants from India ($55,268, a difference of 0.57%), Immigrants from Belgium ($55,082, a difference of 0.91%), and Cypriot ($54,899, a difference of 1.2%).
DemographicsRating | RankPer Capita Income
Immigrants | Iran
100.0
/100
|
#5
Exceptional
$57,759
Immigrants | Taiwan
100.0
/100
|
#6
Exceptional
$57,742
Immigrants | Israel
100.0
/100
|
#7
Exceptional
$57,384
Immigrants | Hong Kong
100.0
/100
|
#8
Exceptional
$56,709
Immigrants | Ireland
100.0
/100
|
#9
Exceptional
$56,584
Okinawans
100.0
/100
|
#10
Exceptional
$55,817
Eastern Europeans
100.0
/100
|
#11
Exceptional
$55,780
Immigrants | Sweden
100.0
/100
|
#12
Exceptional
$55,582
Immigrants | India
100.0
/100
|
#13
Exceptional
$55,268
Immigrants | Belgium
100.0
/100
|
#14
Exceptional
$55,082
Cypriots
100.0
/100
|
#15
Exceptional
$54,899
Immigrants | Switzerland
100.0
/100
|
#16
Exceptional
$54,866
Immigrants | France
100.0
/100
|
#17
Exceptional
$54,557
Thais
100.0
/100
|
#18
Exceptional
$54,307
Immigrants | China
100.0
/100
|
#19
Exceptional
$54,264