Scottish vs Immigrants from Sweden Single Mother Poverty
COMPARE
Scottish
Immigrants from Sweden
Single Mother Poverty
Single Mother Poverty Comparison
Scottish
Immigrants from Sweden
30.1%
SINGLE MOTHER POVERTY
6.0/ 100
METRIC RATING
226th/ 347
METRIC RANK
27.5%
SINGLE MOTHER POVERTY
99.2/ 100
METRIC RATING
75th/ 347
METRIC RANK
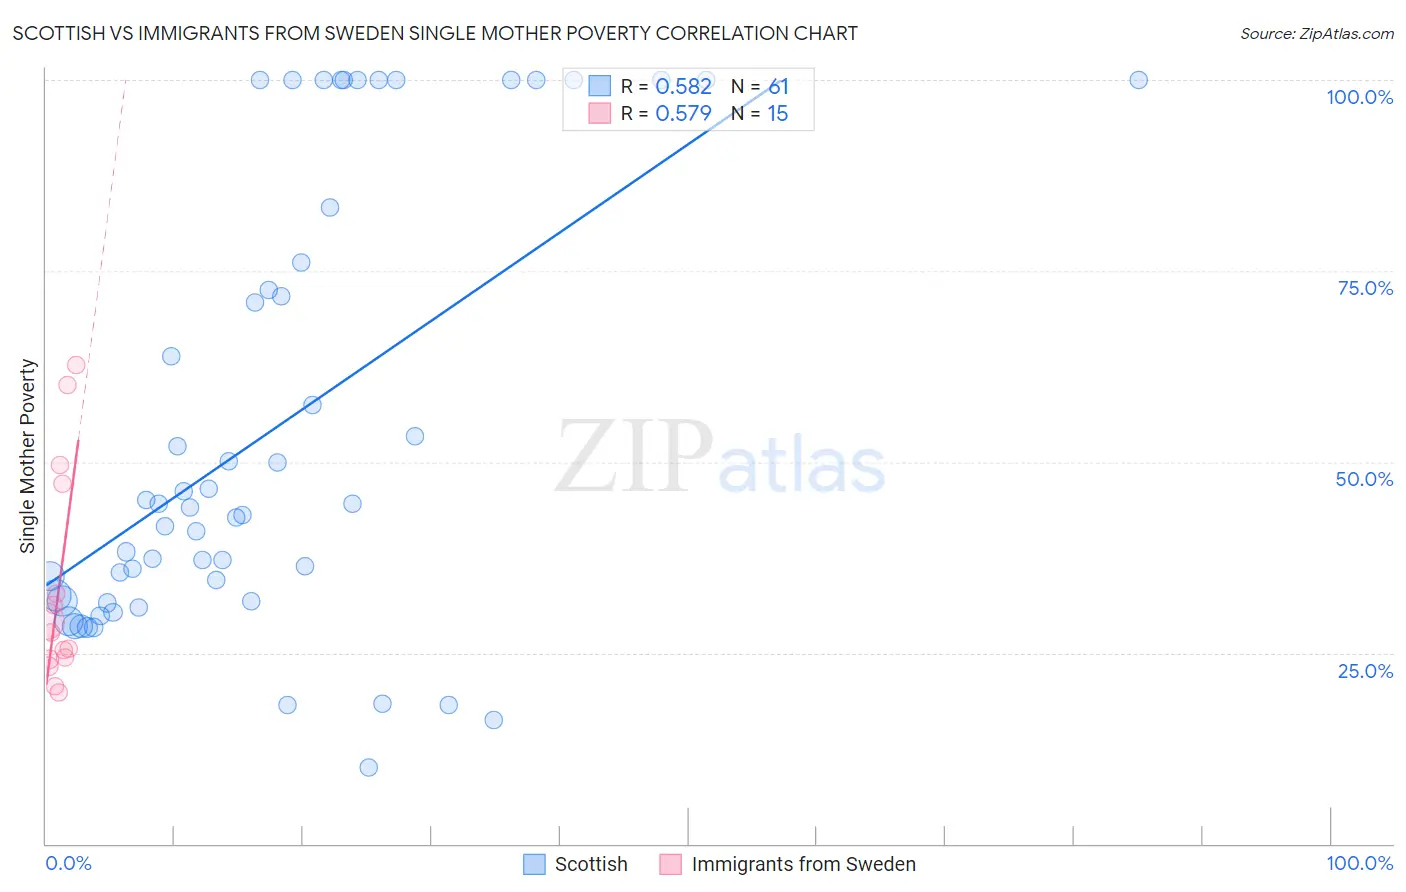
Scottish vs Immigrants from Sweden Single Mother Poverty Correlation Chart
The statistical analysis conducted on geographies consisting of 539,065,597 people shows a substantial positive correlation between the proportion of Scottish and poverty level among single mothers in the United States with a correlation coefficient (R) of 0.582 and weighted average of 30.1%. Similarly, the statistical analysis conducted on geographies consisting of 161,889,555 people shows a substantial positive correlation between the proportion of Immigrants from Sweden and poverty level among single mothers in the United States with a correlation coefficient (R) of 0.579 and weighted average of 27.5%, a difference of 9.6%.
Single Mother Poverty Correlation Summary
| Measurement | Scottish | Immigrants from Sweden |
| Minimum | 10.0% | 19.8% |
| Maximum | 100.0% | 62.7% |
| Range | 90.0% | 42.9% |
| Mean | 54.2% | 33.6% |
| Median | 44.1% | 27.7% |
| Interquartile 25% (IQ1) | 31.8% | 24.2% |
| Interquartile 75% (IQ3) | 79.8% | 47.2% |
| Interquartile Range (IQR) | 48.0% | 23.0% |
| Standard Deviation (Sample) | 28.9% | 14.2% |
| Standard Deviation (Population) | 28.6% | 13.7% |
Similar Demographics by Single Mother Poverty
Demographics Similar to Scottish by Single Mother Poverty
In terms of single mother poverty, the demographic groups most similar to Scottish are Immigrants from Liberia (30.1%, a difference of 0.030%), Spanish (30.1%, a difference of 0.060%), Immigrants from Sudan (30.1%, a difference of 0.090%), Spaniard (30.2%, a difference of 0.14%), and Immigrants from Cuba (30.1%, a difference of 0.16%).
| Demographics | Rating | Rank | Single Mother Poverty |
| Finns | 9.3 /100 | #219 | Tragic 30.0% |
| Germans | 8.8 /100 | #220 | Tragic 30.0% |
| Immigrants | Eritrea | 7.7 /100 | #221 | Tragic 30.0% |
| Sudanese | 7.6 /100 | #222 | Tragic 30.0% |
| Immigrants | Cuba | 6.9 /100 | #223 | Tragic 30.1% |
| Immigrants | Sudan | 6.5 /100 | #224 | Tragic 30.1% |
| Spanish | 6.3 /100 | #225 | Tragic 30.1% |
| Scottish | 6.0 /100 | #226 | Tragic 30.1% |
| Immigrants | Liberia | 5.9 /100 | #227 | Tragic 30.1% |
| Spaniards | 5.4 /100 | #228 | Tragic 30.2% |
| Immigrants | Barbados | 5.0 /100 | #229 | Tragic 30.2% |
| English | 4.8 /100 | #230 | Tragic 30.2% |
| Dutch | 4.3 /100 | #231 | Tragic 30.2% |
| Alaskan Athabascans | 4.1 /100 | #232 | Tragic 30.3% |
| Immigrants | Middle Africa | 3.5 /100 | #233 | Tragic 30.3% |
Demographics Similar to Immigrants from Sweden by Single Mother Poverty
In terms of single mother poverty, the demographic groups most similar to Immigrants from Sweden are Peruvian (27.5%, a difference of 0.040%), Immigrants from Peru (27.5%, a difference of 0.060%), Immigrants from North Macedonia (27.5%, a difference of 0.080%), Immigrants from Italy (27.5%, a difference of 0.11%), and Taiwanese (27.5%, a difference of 0.11%).
| Demographics | Rating | Rank | Single Mother Poverty |
| Immigrants | Czechoslovakia | 99.5 /100 | #68 | Exceptional 27.4% |
| Lithuanians | 99.4 /100 | #69 | Exceptional 27.4% |
| Immigrants | Belarus | 99.4 /100 | #70 | Exceptional 27.4% |
| Macedonians | 99.4 /100 | #71 | Exceptional 27.4% |
| Immigrants | Russia | 99.4 /100 | #72 | Exceptional 27.4% |
| Sierra Leoneans | 99.3 /100 | #73 | Exceptional 27.4% |
| Immigrants | Europe | 99.3 /100 | #74 | Exceptional 27.4% |
| Immigrants | Sweden | 99.2 /100 | #75 | Exceptional 27.5% |
| Peruvians | 99.2 /100 | #76 | Exceptional 27.5% |
| Immigrants | Peru | 99.2 /100 | #77 | Exceptional 27.5% |
| Immigrants | North Macedonia | 99.2 /100 | #78 | Exceptional 27.5% |
| Immigrants | Italy | 99.1 /100 | #79 | Exceptional 27.5% |
| Taiwanese | 99.1 /100 | #80 | Exceptional 27.5% |
| Immigrants | Scotland | 98.9 /100 | #81 | Exceptional 27.6% |
| Immigrants | Cameroon | 98.8 /100 | #82 | Exceptional 27.6% |